
How to Create Infographics in Under an Hour [15 Free Infographic Templates]
Infographics have changed the world of blogging. Instead of readers having to read a lot of writing, they now have the benefit of accessing the same information or data in a visual representation.
Visual content has become as important, if not more, as written content. The reason for this is because the mind is often intrigued by visuals more than it is by written content. It is important for you to master the skill of creating infographics if you want to ensure that you retain your audience and gain more interested viewers for your blog.
We’ve decided to simplify infographics for you, so that you may be able to do it on your own and design visuals that will not only capture your audience but be a representation of yourself as you have created them on your own.
First things first:
Download our 15 free infographic templates here.
Once you have downloaded the template that you feel will best represent your work, all you have to do is now fill it with the content that is required. Please note that the content of the infographic is as important as the info graphic itself.
Want to watch and listen to the instructions as you read the steps below? Check out the video below:
How to Make an Infographic
- Identify the audience for your infographic.
- Collect your content and relevant data.
- Choose your desired infographic template.
- Download your template to PowerPoint.
- Customize your infographic.
- Include a footer with your sources and logo.
- Add an embed code and Pinterest button, and publish it.
1. Identify the audience for your infographic.
As I had already mentioned, the content of the infographic is as important as the infographic itself. To ensure that the infographic will be impactful, you need to know the audience which you will be presenting it to. Understanding your audience is one of the most basic principles in marketing. The audience will dictate the type of infographic you decide on and the content which you include.
2. Collect your content and relevant data
Now that you have chosen your audience, it is time for you to either create the relevant content and data for them or you could use third party content and data. Always ensure that you cite the content and data if it is from a third party
Organizing Your Data
You should already have a story in mind that you want to tell your audience when you are collecting your data. This will help you to ensure that the data is organized in a manner that the story that you are trying to tell is clear to the audience.
Compelling data needs to be “comprehensive” enough to give your readers proper context around the data you’re presenting. Providing background, such as previous data, can help your audience to understand your infographic easily. There should be a reason for the content you provide. This helps to clear any questions that the audience might have.
Citing Your Sources
To keep your infographic uncluttered by a ton of different source URLs, a great way to cite your sources is to include a simple URL at the bottom of your infographic that links to a page on your site. You can also list the individual stats used in your infographic, and their sources — such as the landing page to the full offer on which you’re basing this free infographic.
3. Choose your desired infographic template.
Choosing the right template to use for the infographic is very important as this will clarify the information for your audience. The appropriate template needs to be chosen for the data you want to represent, ensuring that the template will also help the data to be self-explanatory for your audience.

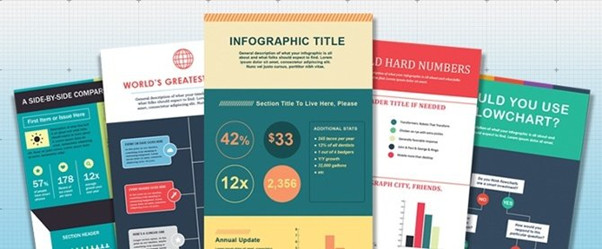
Types of Infographics:
- Side-by-side comparison infographic: This infographic design can help prove the advantage of one concept over another, or simply explain the differences between two competing entities.
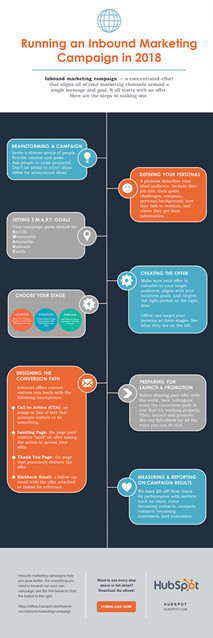
- Flowchart infographic: This design is perfect for presenting a new workflow for your organization, or how a linear or cyclical process works across your industry.
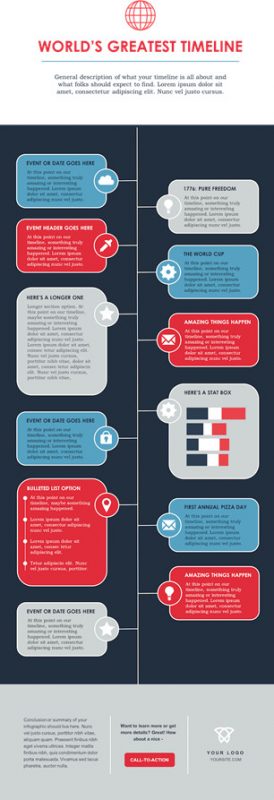
- Timeline infographic: This design can tell a chronological story, or history, of a business, industry, product, or concept.
- Graph-based infographic: This design is suitable for content creators publishing a high volume of data and statistical information, making it a good fit for expert-level audiences, too.
- Image-heavy infographic: This design caters to content creators who are trying to reveal trends and information from shapes, designs, or photography — rather than just numbers and figures.
4. Download your template to PowerPoint.
You can simply download your chosen template to Power Point or any other slide deck platforms you are accustomed to as it will form part of your presentation.
5. Customize your infographic
I know that this might feel like the most difficult step, but honestly, this is the fun part. All you have to do is to come up with a catchy title for the infographic that you have chosen. Once you have the perfect title, you now just have to insert the data or relevant content to the infographic. Lastly, remember that you can play around with the infographic in various ways, such as changing the colours to your corporate colours or changing the font and style to what will suite your audience best.
6. Include a footer with your sources and logo.
This step is important as you want the people to know who created the infographic if it gets shared amongst other people. It should be made easy for people to find where the infographic originates from.
7. Add embed code and a Pinterest button, and publish it.
The only thing left to do is to publish and promote your awesome new infographic. As I mentioned earlier, we recommend using your blog to publish it (including your list of sources), including a Pinterest button for visitors to easily “pin” your infographic on Pinterest, and create and add an embed code for visitors to share it on their own websites and blogs, as we did above.
