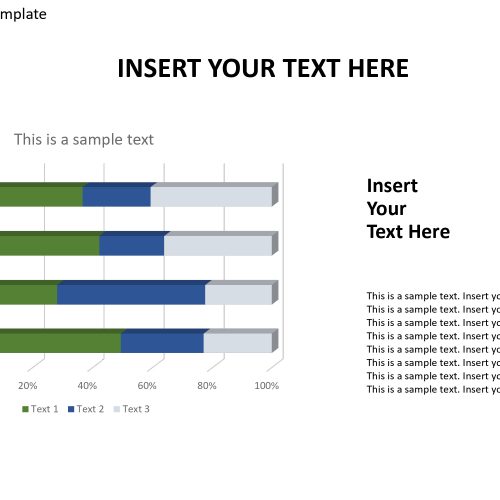
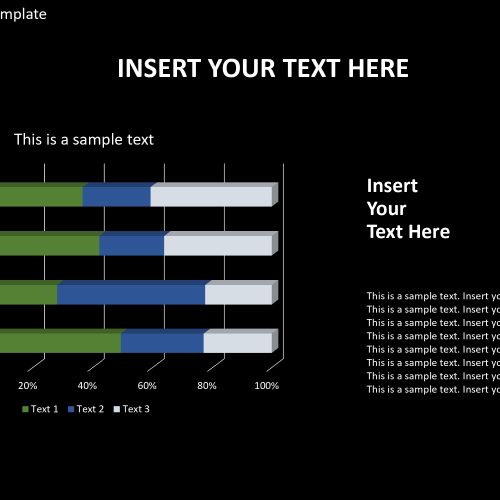
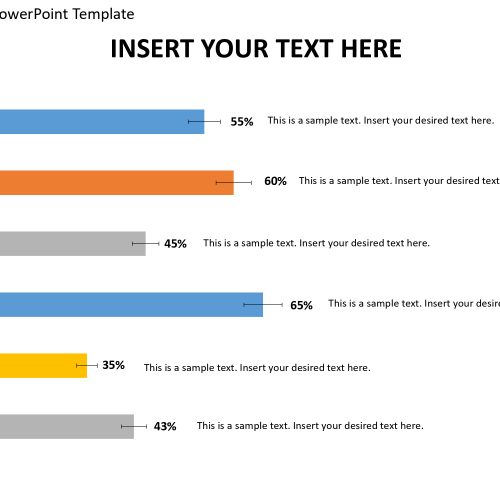
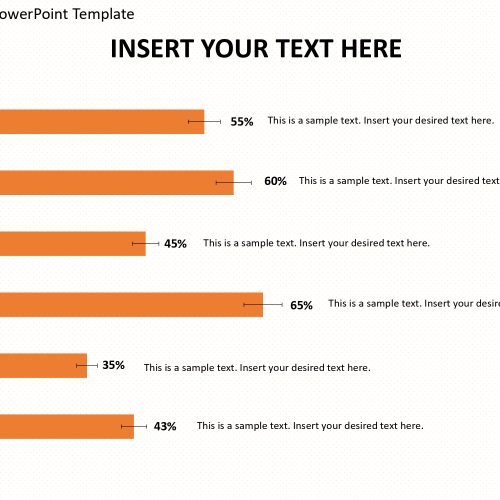
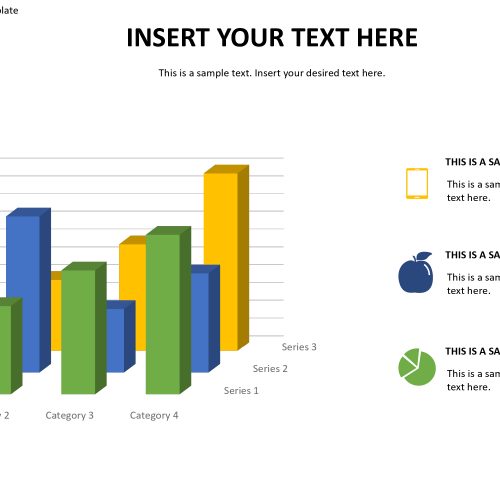
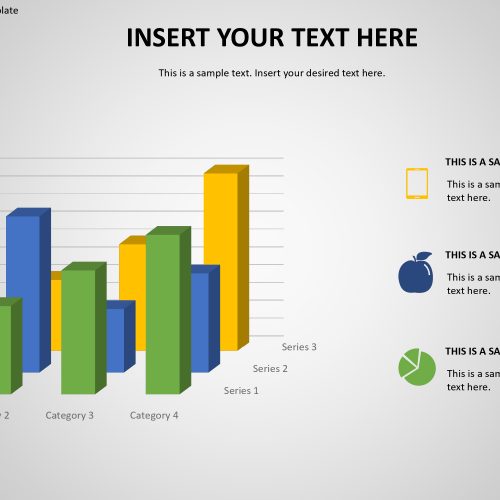
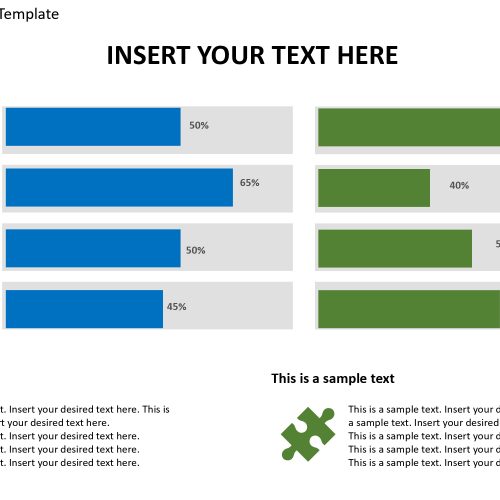
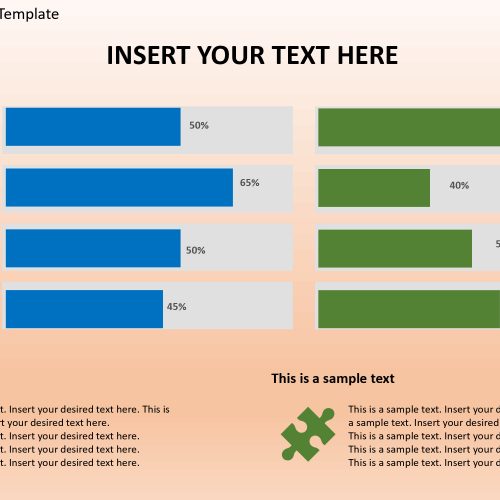
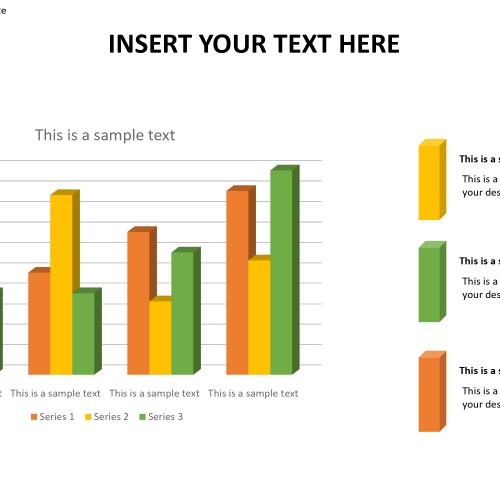
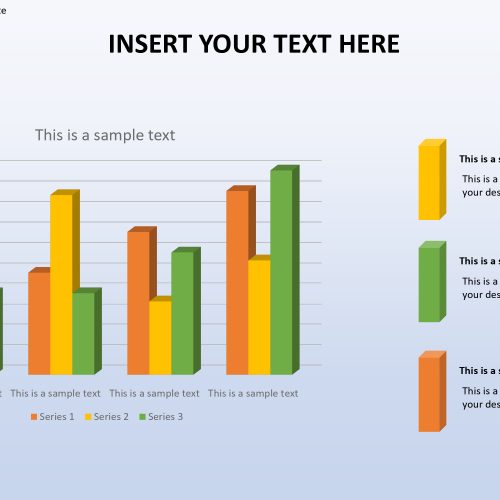
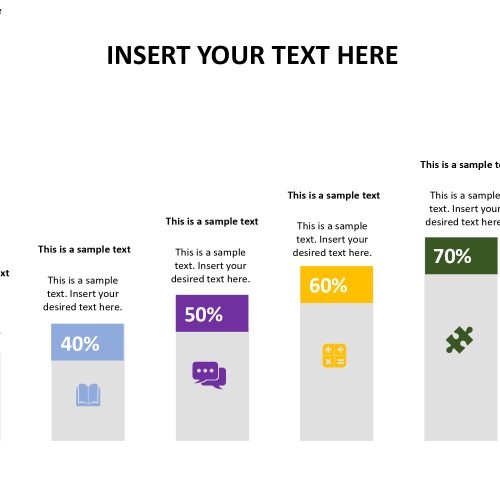
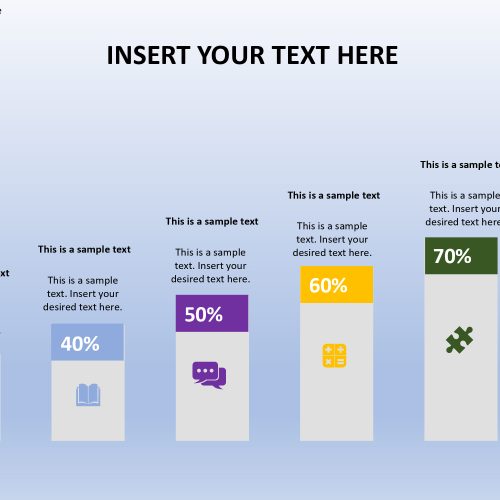
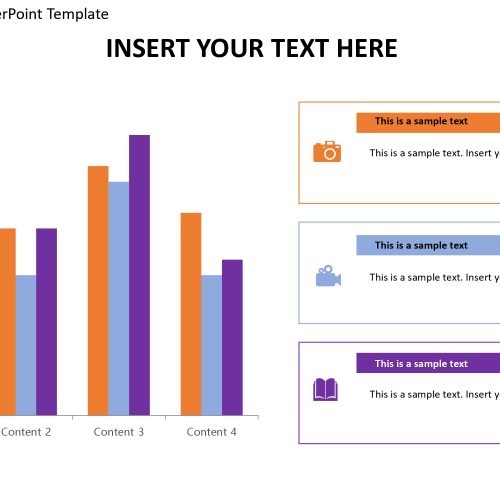
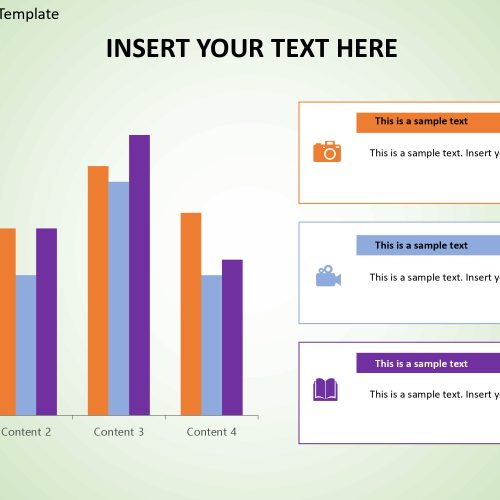
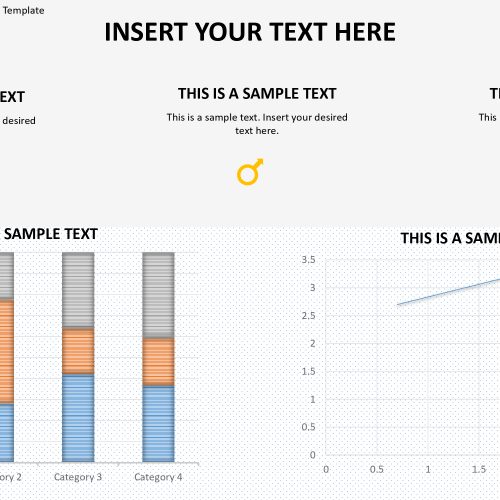
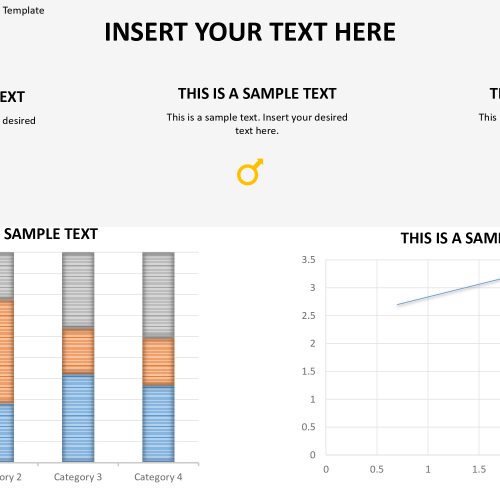
Bring your data to life with our collection of fully editable bar chart presentation templates. Whether you’re a business professional, student, or just someone looking to organize and present data in a clear and visually appealing way, our templates are the perfect solution. With easy-to-edit designs and customizable bar charts, our templates will save you a lot of time and effort. Impress your audience with effective and professional-looking bar charts and make your data easy to understand. Don’t waste time creating bar charts from scratch – choose from our wide selection of templates and make your next presentation a success!


Q: How do I create a bar chart in PowerPoint?

A: To create a bar chart in PowerPoint, select the "Insert" tab, then click on "Chart." Choose the "Bar" chart option and select a sub-type. Enter your data into the chart, customize the design, and you're all set.

Q: Can I animate a bar chart in PowerPoint?

A: Yes, you can animate a bar chart in PowerPoint by selecting the chart and going to the "Animations" tab. Choose an animation effect and customize the settings to your liking.

Q: How do I change the color of a bar in a PowerPoint chart?

A: To change the color of a bar in a PowerPoint chart, select the chart and go to the "Format" tab. Click on "Shape Fill" and choose the desired color. You can also use the "Shape Outline" option to change the color of the bar's border.

Q: Can I add data labels to a bar chart in PowerPoint?

A: Yes, you can add data labels to a bar chart in PowerPoint by selecting the chart and going to the "Chart Tools" tab. Choose "Layout" and then select "Data Labels." Choose the type of data label you'd like to add and customize the settings to your liking.

Q: Can I make a bar chart in PowerPoint with two y-axes?

A: Yes, you can make a bar chart in PowerPoint with two y-axes by selecting the chart and going to the "Chart Tools" tab. Choose "Layout" and then select "Axes." Select "Secondary Axis" and customize the settings to your liking.

Q: How do I add a legend to a bar chart in PowerPoint?

A: To add a legend to a bar chart in PowerPoint, select the chart and go to the "Chart Tools" tab. Choose "Layout" and then select "Legend." Customize the legend settings to your liking.