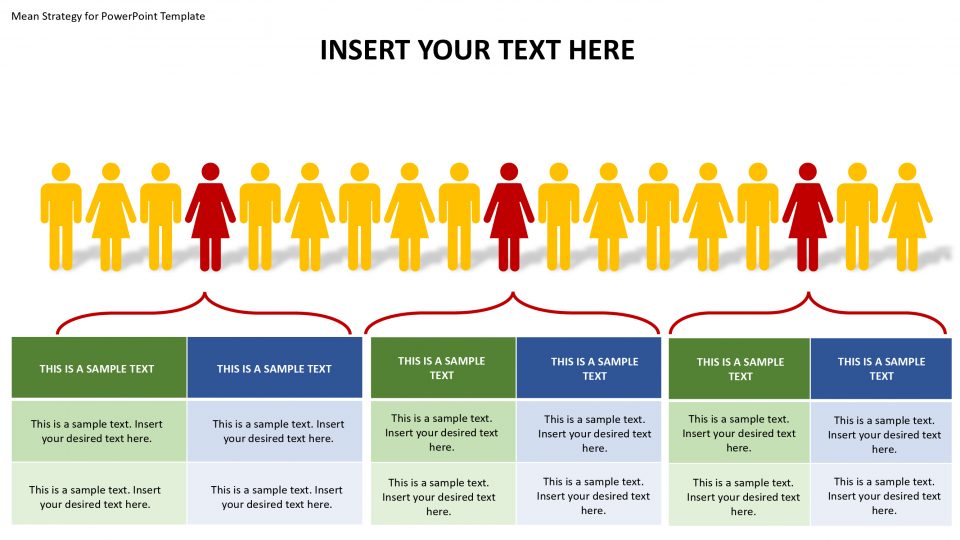
Mean Strategy for PowerPoint Template is a high-quality, professionally designed PowerPoint template that provides you the ability to create amazing Google Slides presentations. This template comes with editable content and customization so you can adjust settings to fit your needs. Feel free to add text, images and videos while remaining in full control of the final outcome of your PowerPoint slide deck.
Features:
- Completely editable in terms of shape, color, size and text
- This template has a built in color theme which is unaffected by copy-pasting
- Includes an icon family with 135 unique completely editable icons
- Drag and drop image placeholder
- Completely editable (using spreadsheet) data-driven charts for displaying statistics
- Completely editable vector graphics
Supports
Microsoft PowerPoint 2010, 2011, 2013, 2016
MacOffice 2016, MacOffice 365, Google Slides


Be the first to review “Mean Strategy for PowerPoint Template”