

Product Quality by Region PowerPoint Presentation is a powerful tool designed to help businesses analyze and compare the quality of their products across different regions. This comprehensive presentation template allows users to showcase data related to product quality in a visually appealing and easy-to-understand manner.
The presentation features a variety of slide layouts, charts, graphs, and infographics that can be easily customized to suit the specific needs of your business. Whether you are looking to assess the quality of your products in different geographical areas or compare the performance of your products in various markets, this PowerPoint presentation has got you covered.
One of the key features of Product Quality by Region PowerPoint Presentation is its fully editable templates. Users can easily modify the colors, fonts, and layout of the slides to match their brand identity. This flexibility allows businesses to create customized presentations that effectively communicate their product quality data to stakeholders and decision-makers.
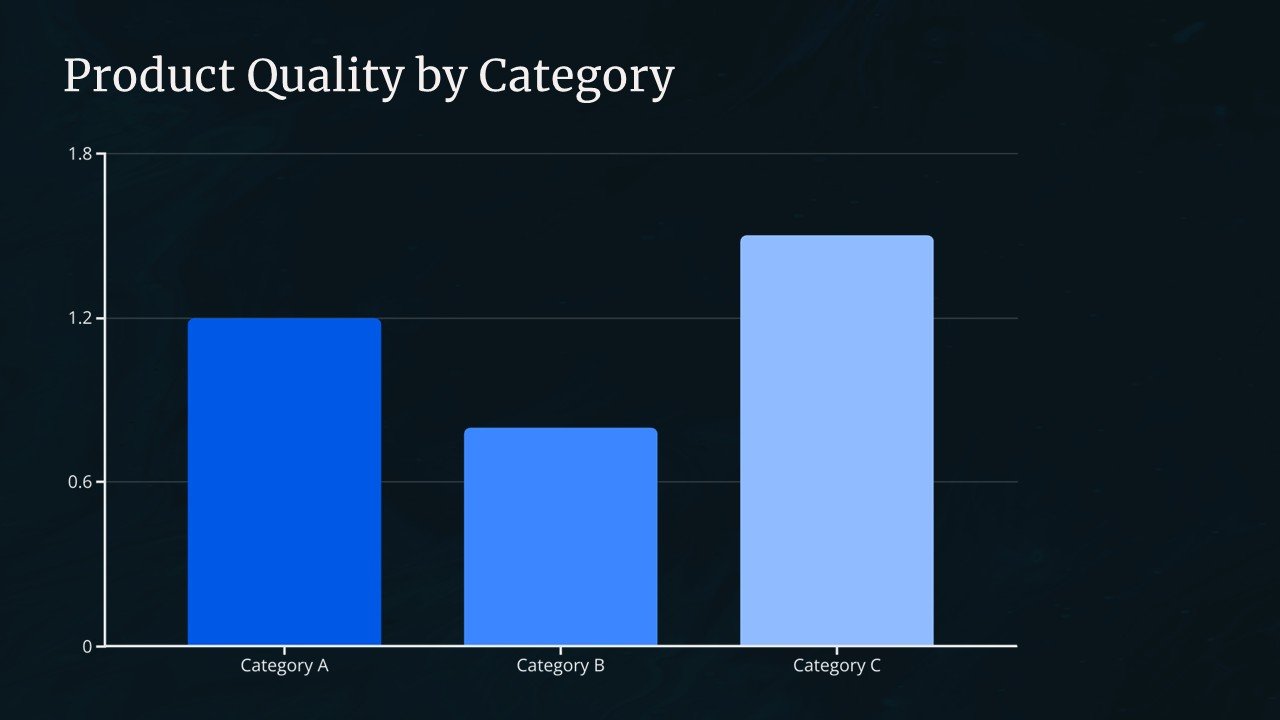
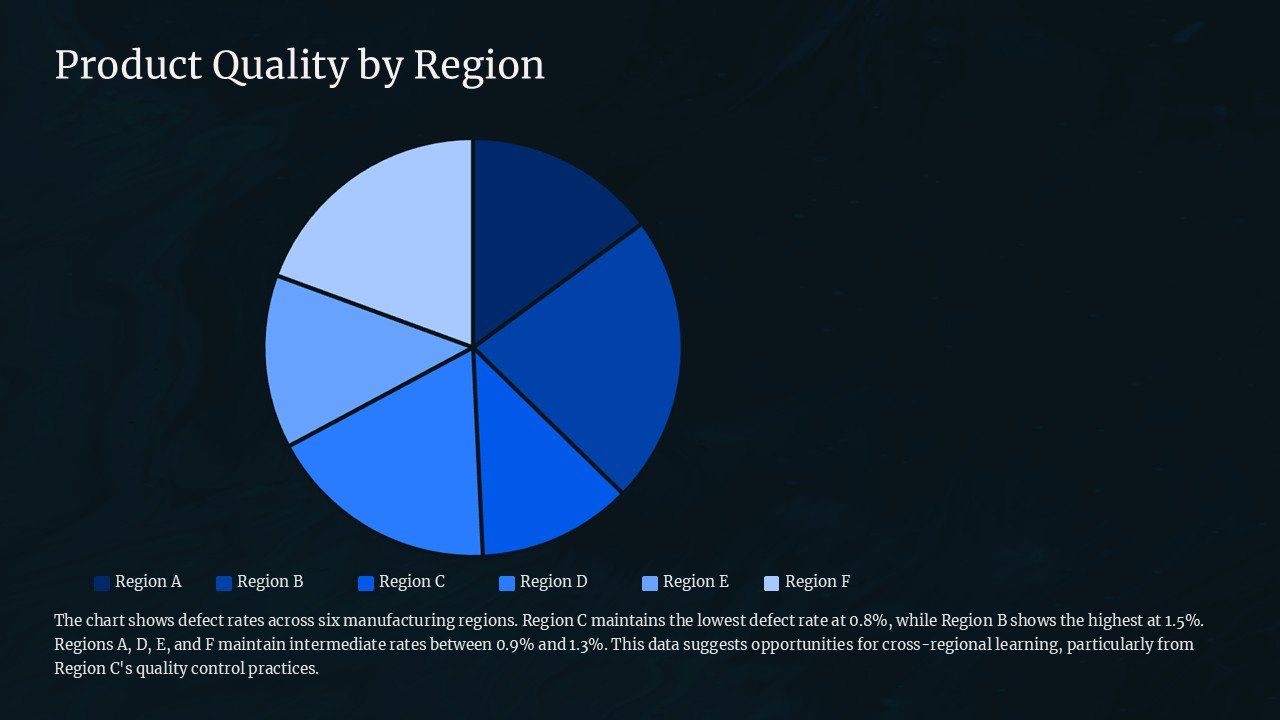
In addition, the presentation includes various data visualization tools such as bar charts, pie charts, and maps, making it easy to present complex data in a clear and concise manner. With Product Quality by Region PowerPoint Presentation, businesses can gain valuable insights into the performance of their products in different regions and make data-driven decisions to improve product quality and drive business growth.

Be the first to review “Product Quality by Region PowerPoint Presentation”