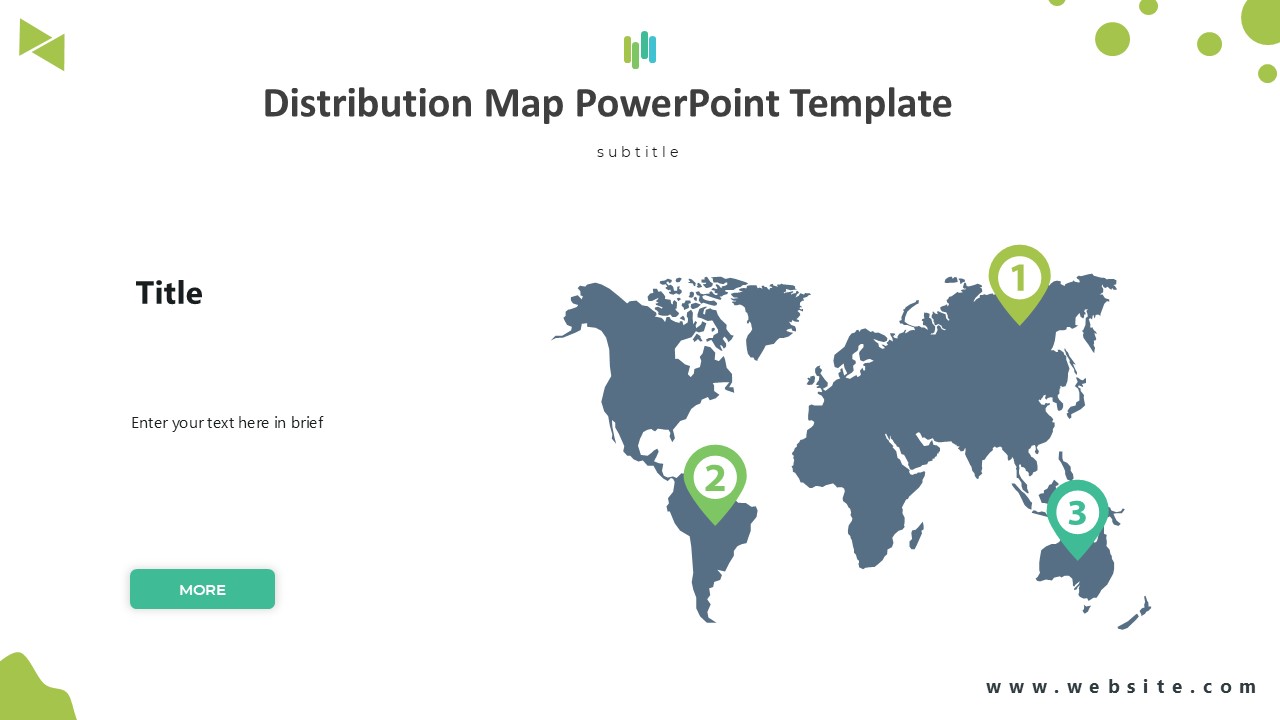
The Distribution Map PowerPoint Template is a versatile tool that allows users to effectively visualize geographical data in an engaging and informative way. Whether you are presenting market expansion strategies, sales reports, or regional demographics, this template provides a clear and concise way to communicate information to your audience.
This template features a variety of map layouts, including world maps, continent maps, and country maps, to cater to different levels of geographical detail. Users can easily customize the maps to highlight specific regions, add data points, and adjust colors to match their branding or presentation theme. With pre-designed slides for key regions and countries, users can quickly create professional-looking presentations without spending hours on design.
One of the standout features of this Distribution Map PowerPoint Template is its fully editable nature. Users have full control over every element of the template, from the map itself to the text boxes, icons, and colors. This level of customization ensures that users can tailor the template to their specific needs and create a presentation that truly stands out.
In addition to its flexibility, this template also offers a range of features that make it user-friendly and accessible to all levels of PowerPoint users. With clear instructions and helpful tips included, even beginners can quickly learn how to make the most of the template and create compelling visualizations.
Overall, the Distribution Map PowerPoint Template is a must-have tool for anyone looking to present geographical data in a clear and impactful way. With its customizable maps, user-friendly features, and professional design, this template is sure to take your presentations to the next level.


Be the first to review “Distribution Map PowerPoint Template”