About this PowerPoint template
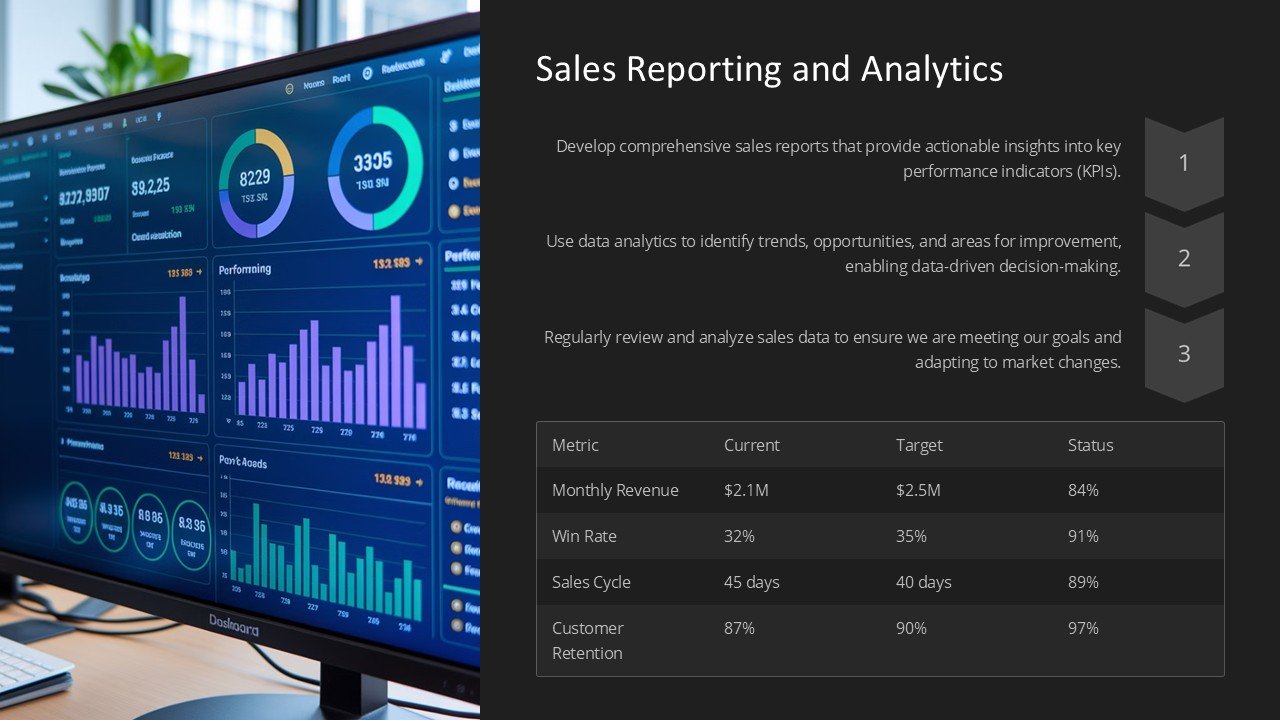
Sales Reporting and Analytics PowerPoint Presentation is a comprehensive tool designed to help businesses track and analyze their sales performance effectively. This professionally crafted presentation template is packed with all the necessary slides and visuals needed to create a powerful sales report or presentation.
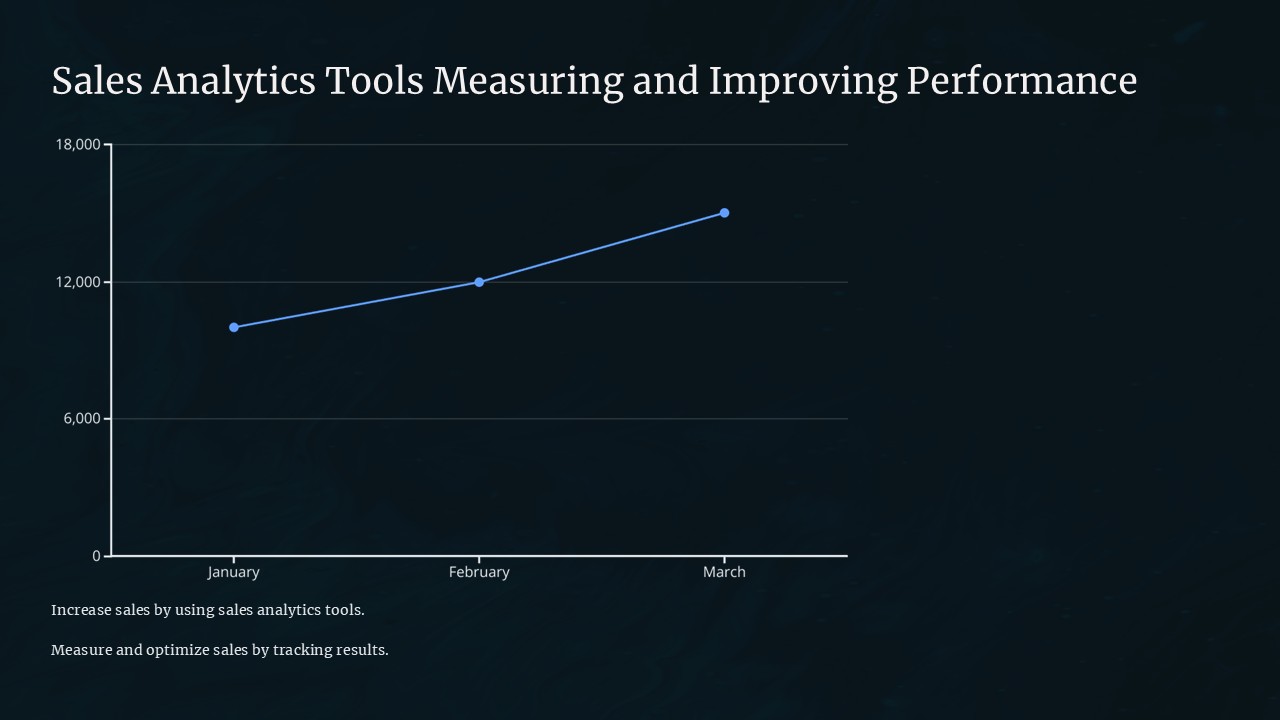
With Sales Reporting and Analytics PowerPoint Presentation, you can showcase your sales data in a visually appealing manner, making it easier for your audience to understand complex information. The template includes various charts, graphs, and tables that can be easily customized to suit your specific needs. Whether you need to report on monthly sales figures, analyze sales trends, or present forecasts, this presentation template has got you covered.
One of the key features of Sales Reporting and Analytics PowerPoint Presentation is its fully editable templates. This means that you can easily customize the slides to align with your brand guidelines and messaging. You can change the colors, fonts, and layout of the slides with just a few clicks, allowing you to create a tailored presentation that reflects your unique style.
Other features of Sales Reporting and Analytics PowerPoint Presentation include:
- Professionally designed slides for presenting sales data
- Easy-to-use charts and graphs for visualizing complex information
- Detailed tables for displaying numerical data
- Multiple layout options for creating a cohesive presentation
- Fully editable templates for easy customization
- Compatible with Microsoft PowerPoint and Google Slides
In conclusion, Sales Reporting and Analytics PowerPoint Presentation is the ultimate tool for creating compelling sales reports and presentations. With its fully editable templates and user-friendly features, this presentation template will help you showcase your sales data in a clear and concise manner, ensuring that your audience stays engaged and informed.
Template details
| Template | Sales Reporting and Analytics PowerPoint Presentation |
|---|---|
| Category | PowerPoint Presentations |
| File format | PowerPoint (.pptx) |
| Slide size | 16:9 widescreen |
| Preview images | 1 |
| Editable | Yes: text, colours, shapes, icons and charts |
| Works with | PowerPoint 2010 and later, PowerPoint for Mac, Google Slides |
| Licence | Royalty-free, yours to keep using after your plan ends (terms of use apply) |
| Price | Included in every SlideVilla plan |
| Added | 9 Feb 2025 |
Questions about this template
Can I edit the Sales Reporting and Analytics PowerPoint Presentation?
Yes. Every part of the Sales Reporting and Analytics PowerPoint Presentation is made with native PowerPoint shapes and text boxes, so you can change the wording, colours, fonts and sizes, move or delete elements, and swap icons without losing quality.
Does the Sales Reporting and Analytics PowerPoint Presentation work in Google Slides?
Yes. Download the .pptx file, upload it to Google Drive and open it with Google Slides. The layout, shapes and text stay editable there too.
Is the Sales Reporting and Analytics PowerPoint Presentation free?
It is a premium template, included in every SlideVilla plan together with the rest of the library. See plans and pricing.
What size and format is it?
It is a PPTX file in 16:9 widescreen format, with 1 preview image shown above.
How to use this template
- Step 1DownloadClick Download and the .pptx file saves straight to your computer.
- Step 2OpenOpen it in PowerPoint, or upload it to Google Slides from your Drive.
- Step 3Make it yoursChange text, colours, icons and charts. Every element is fully editable.
Categories
Related PowerPoint templates
More designs like this one, ready to edit.