

About this PowerPoint template
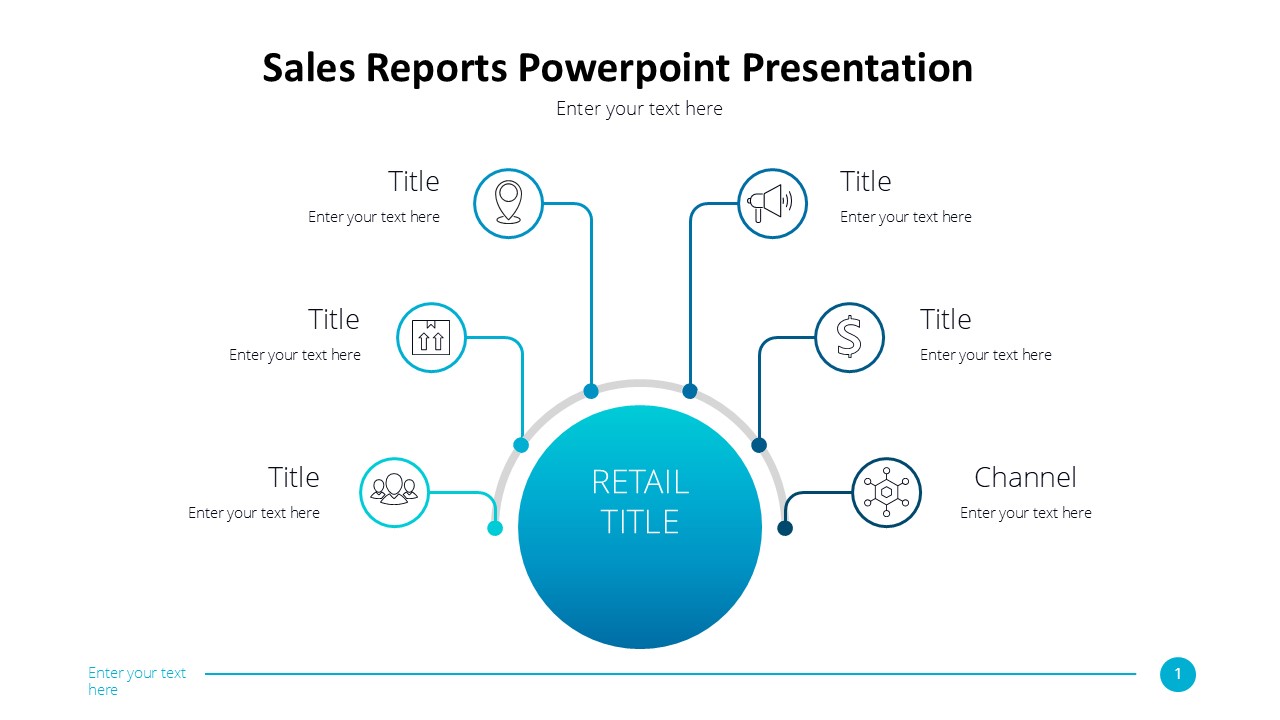
The Sales Reports PowerPoint Template is a complete 25-slide presentation: a practical approach to clear, useful, action-oriented reporting. Every slide is fully editable in PowerPoint and Google Slides, so you can change the text, colours, charts and icons to fit your brand in minutes.
Inside, the slides walk through topics such as “Decision-first reporting resolves the insight gap”, “Revenue and pipeline answer different questions” and “A steady review rhythm keeps insight actionable”, with ready-made layouts for each step. It is part of our Sales, Marketing & Customer presentations.
On this page
What's included
- 25 professionally designed 16:9 widescreen slides
- 100% editable text, shapes, icons, tables and charts (no flat images)
- Works in Microsoft PowerPoint (Windows and Mac) and Google Slides
- Clean, consistent layout that follows your theme colours and fonts
- Delivered as a single ZIP file containing the .pptx presentation
What to include in a sales presentation
A simple structure that works for most audiences, mapped to the slides in this deck:
| Part | What goes there | Slide in this deck |
|---|---|---|
| Results summary | Revenue vs target, growth and key wins | Slides 3, 6, 10 |
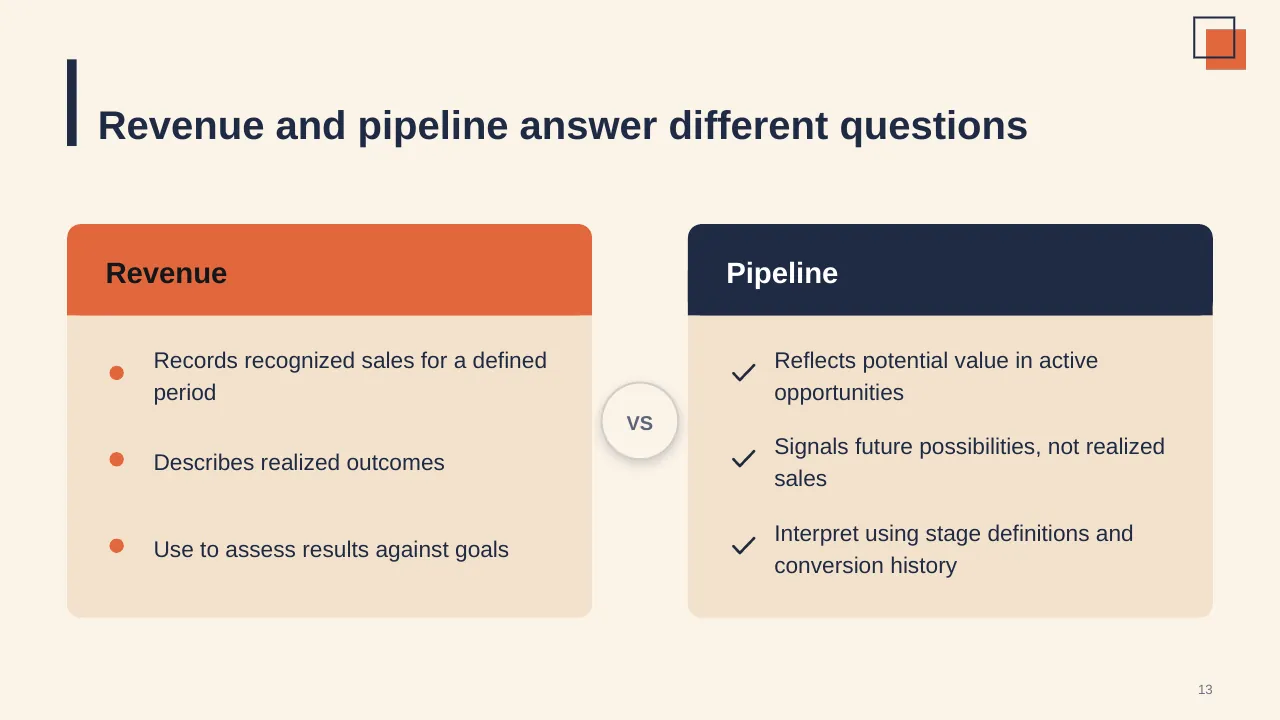
| Pipeline | Stage-by-stage pipeline and coverage | Slide 13 |
| By segment | Region, product or customer breakdown | Slide 15 |
| What worked and what didn't | Wins, losses and lessons | Slides 4, 22 |
| Plan and actions | Targets, plays and support needed | Slides 2, 8, 22 |
Key numbers: Sales
Research figures you can quote on your slides. Each one names the study it comes from, so your audience can check it.
| Finding | Figure | Source |
|---|---|---|
| Share of a sales rep's week spent actually selling | 28% | Salesforce, State of Sales, 5th ed. |
| Reps who say selling is harder now | 69% | Salesforce, State of Sales, 5th ed. |
| Reps who don't expect to meet quota this year | 67% | Salesforce, State of Sales, 6th ed. |
| Reps who missed quota last year | 84% | Salesforce, State of Sales, 6th ed. |
Sources: Salesforce, State of Sales snapshot · Salesforce, 6th State of Sales. Figures are from the editions named; check for a newer edition before you present.
Slide-by-slide outline
| Slide | What it covers |
|---|---|
| 1 | Title slide: Sales Reports |
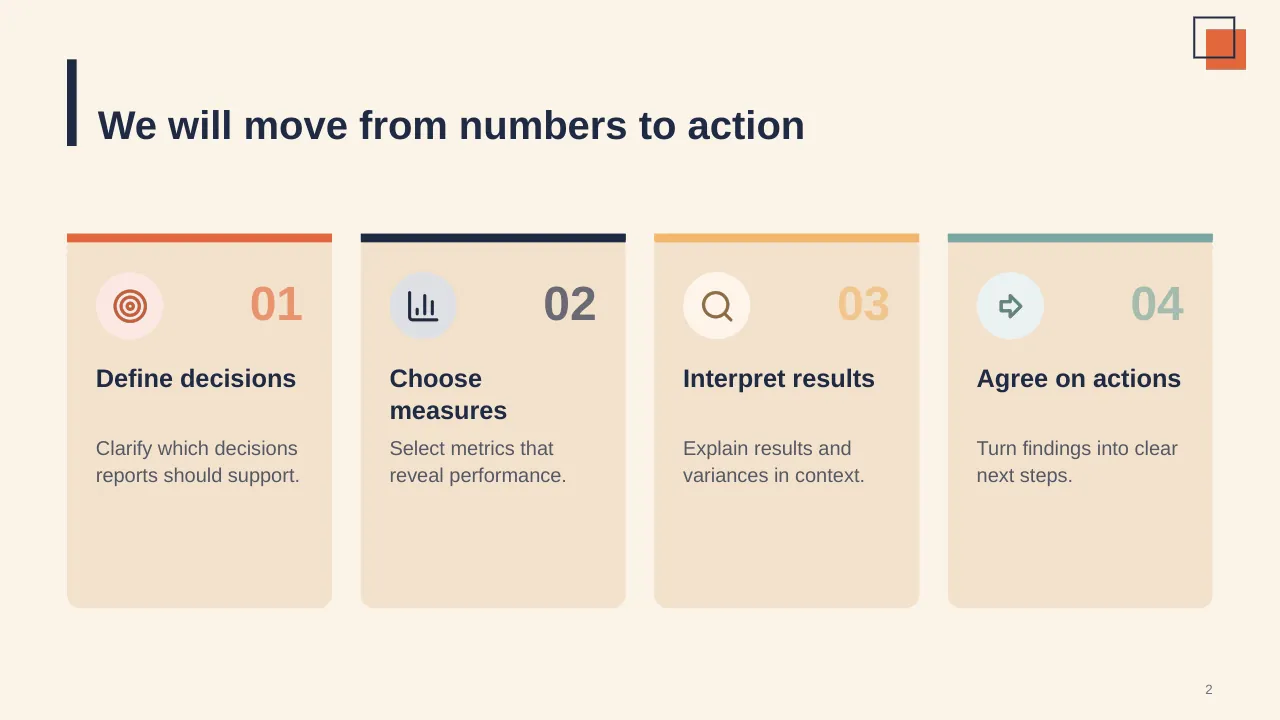
| 2 | We will move from numbers to action |
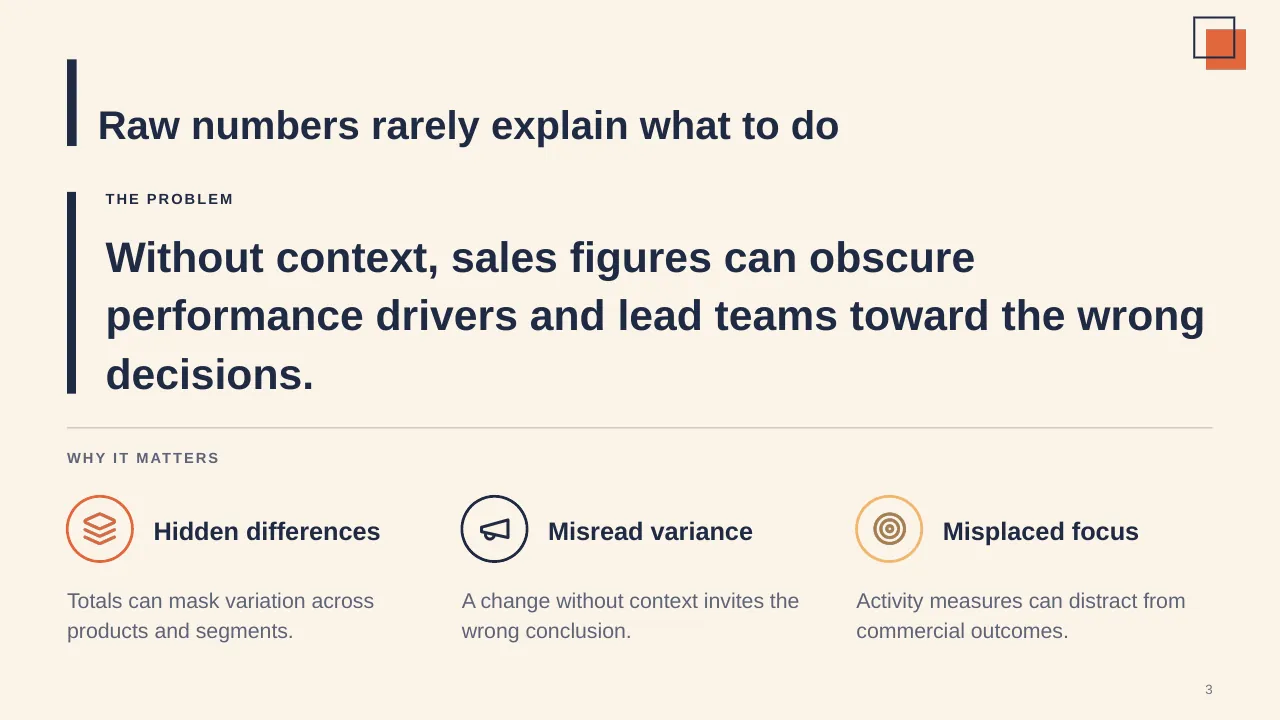
| 3 | Without context, sales figures can obscure performance drivers and lead teams toward the wrong decisions. |
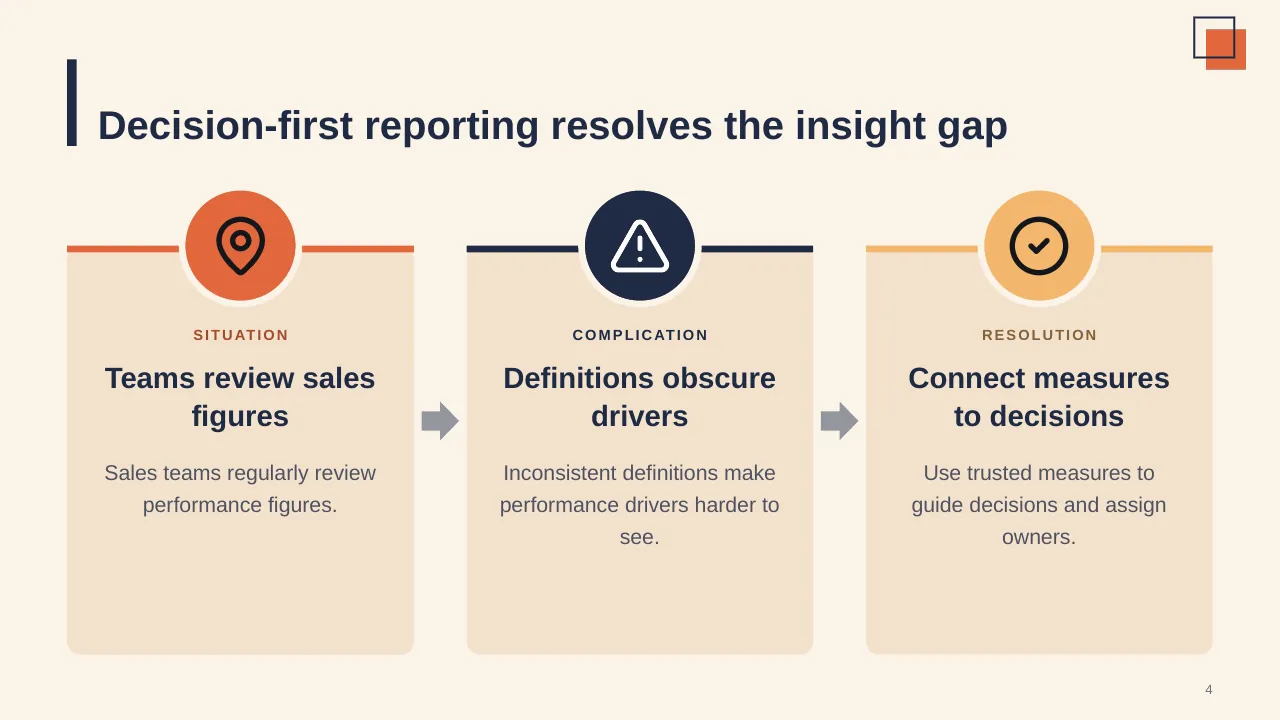
| 4 | Decision-first reporting resolves the insight gap |
| 5 | Start with the decision, then choose measures and context. |
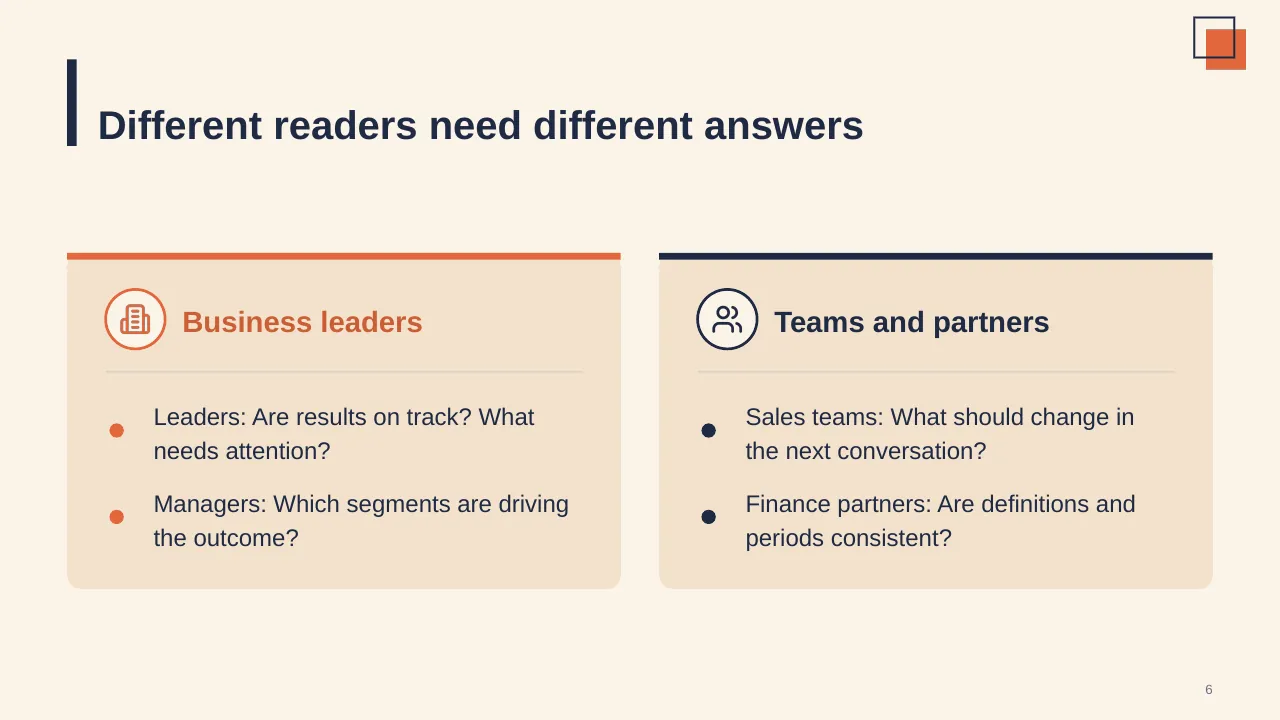
| 6 | Leaders: Are results on track? What needs attention? |
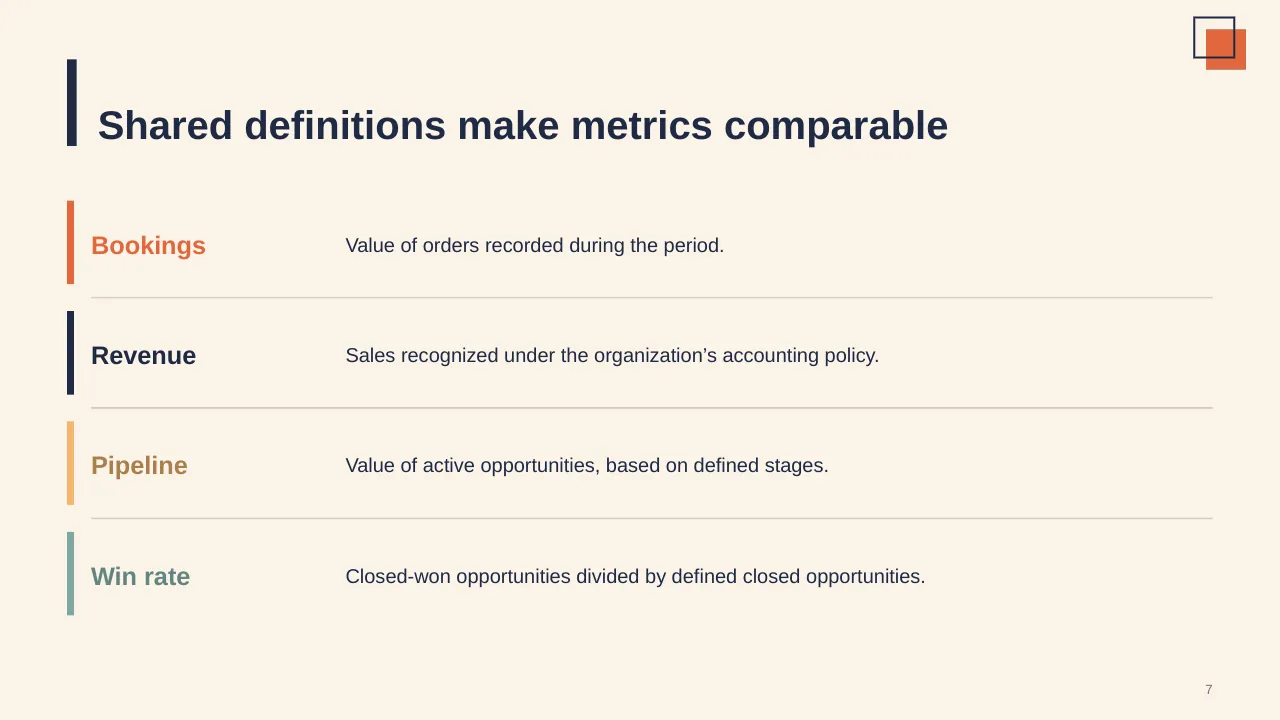
| 7 | Value of orders recorded during the period. |
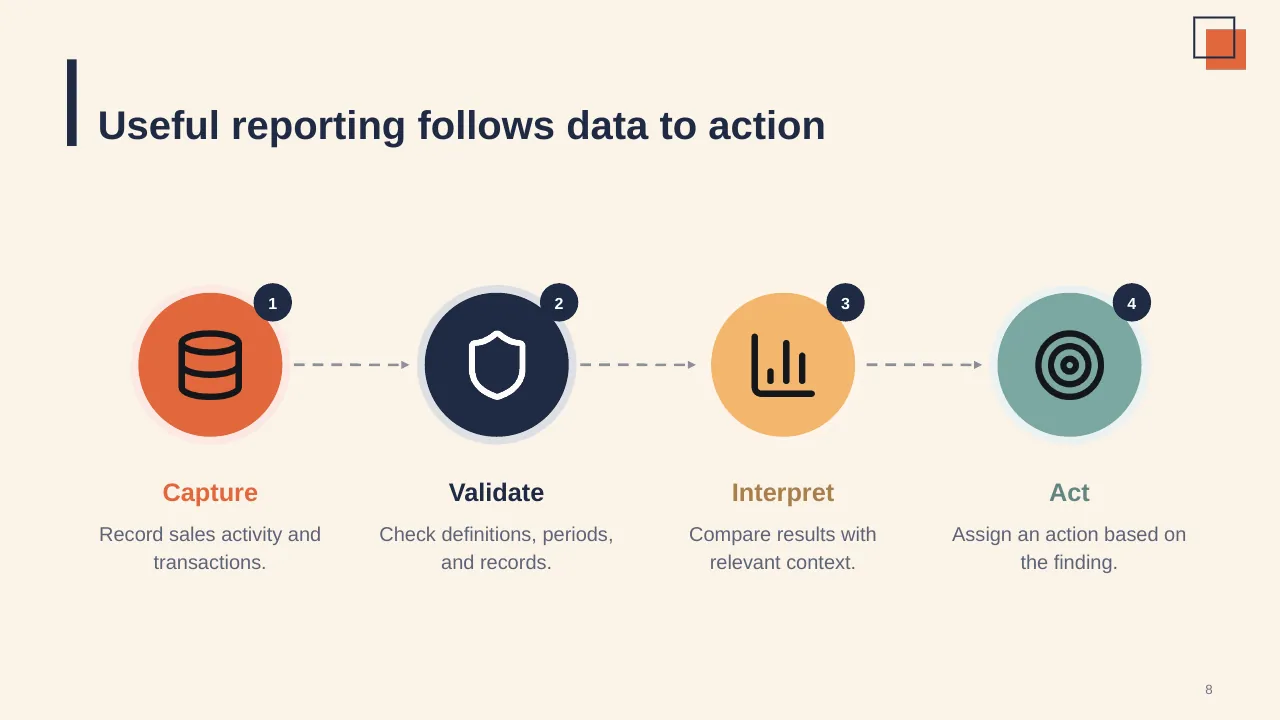
| 8 | Useful reporting follows data to action |
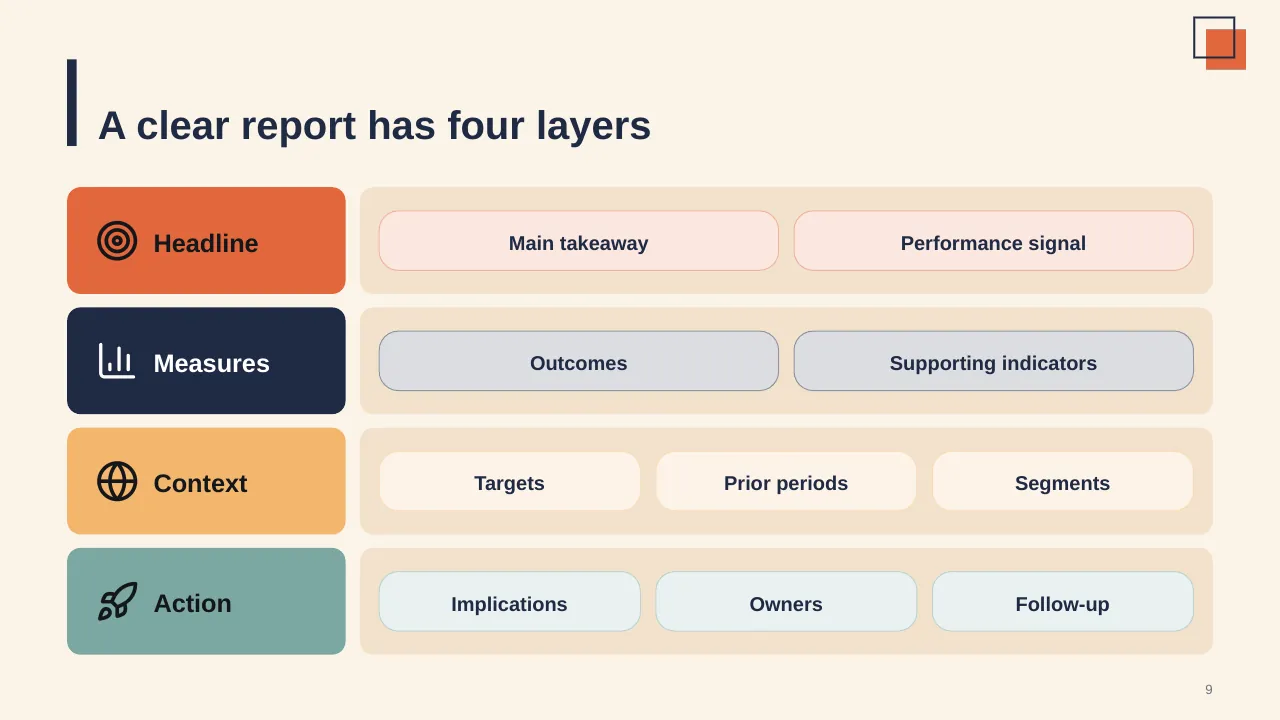
| 9 | A clear report has four layers |
| 10 | Compare periods consistently, explain what moved results, and separate evidence from interpretation. |
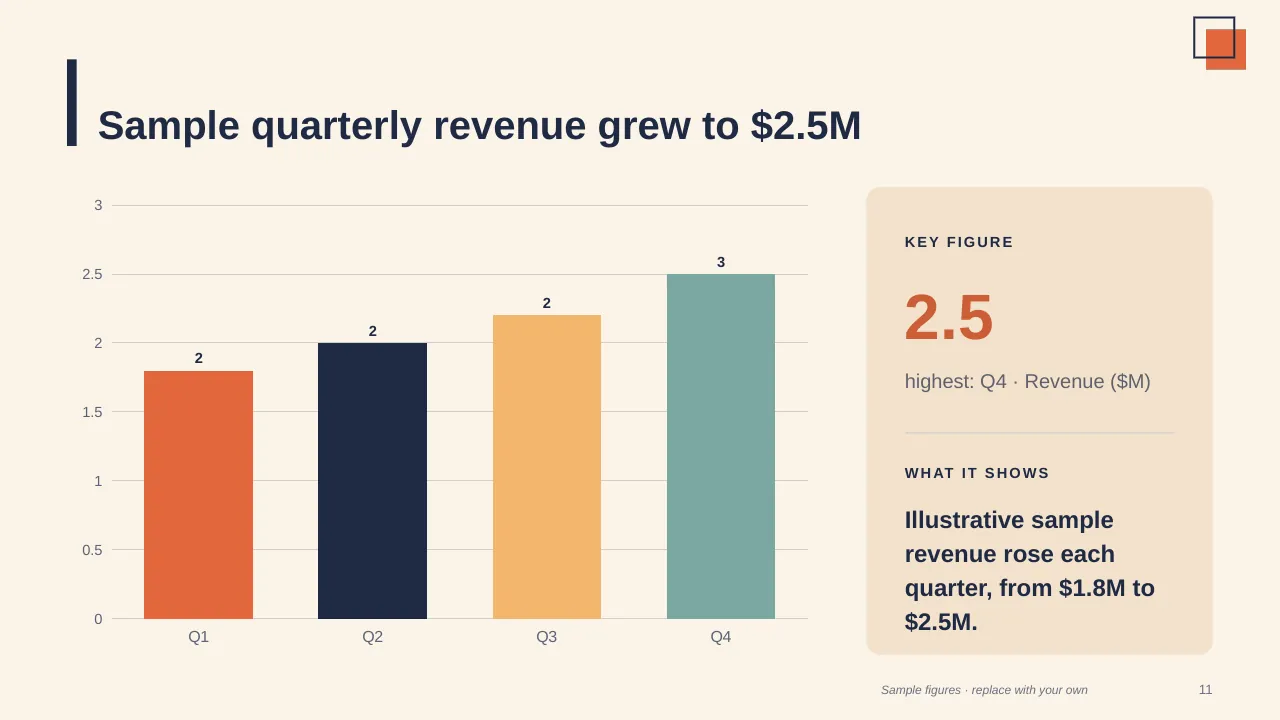
| 11 | Sample quarterly revenue grew to $2.5M |
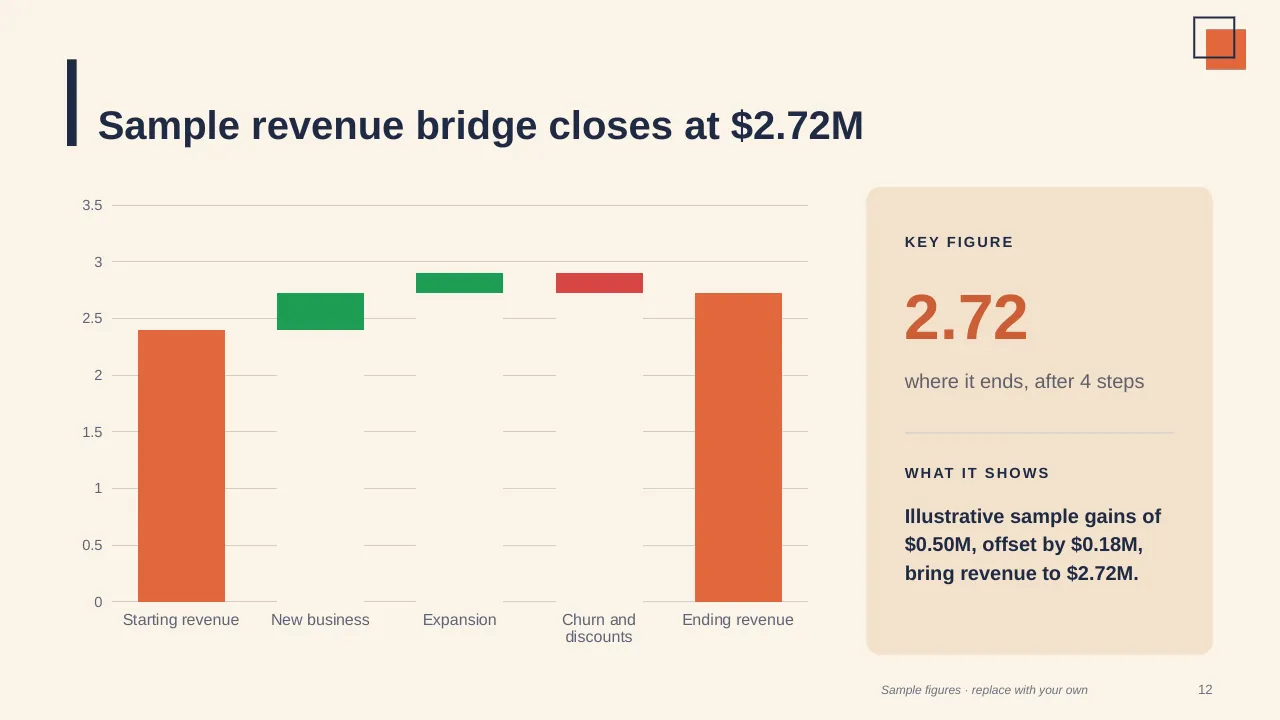
| 12 | Sample revenue bridge closes at $2.72M |
| 13 | Revenue and pipeline answer different questions |
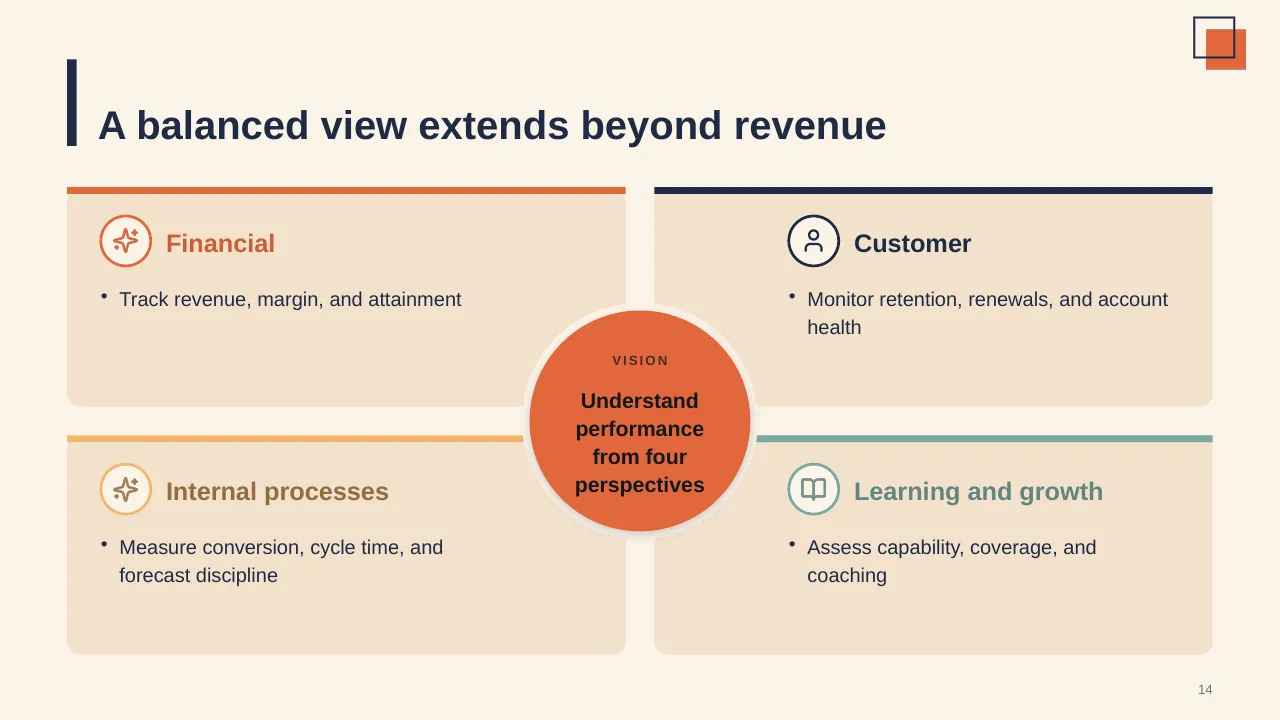
| 14 | A balanced view extends beyond revenue |
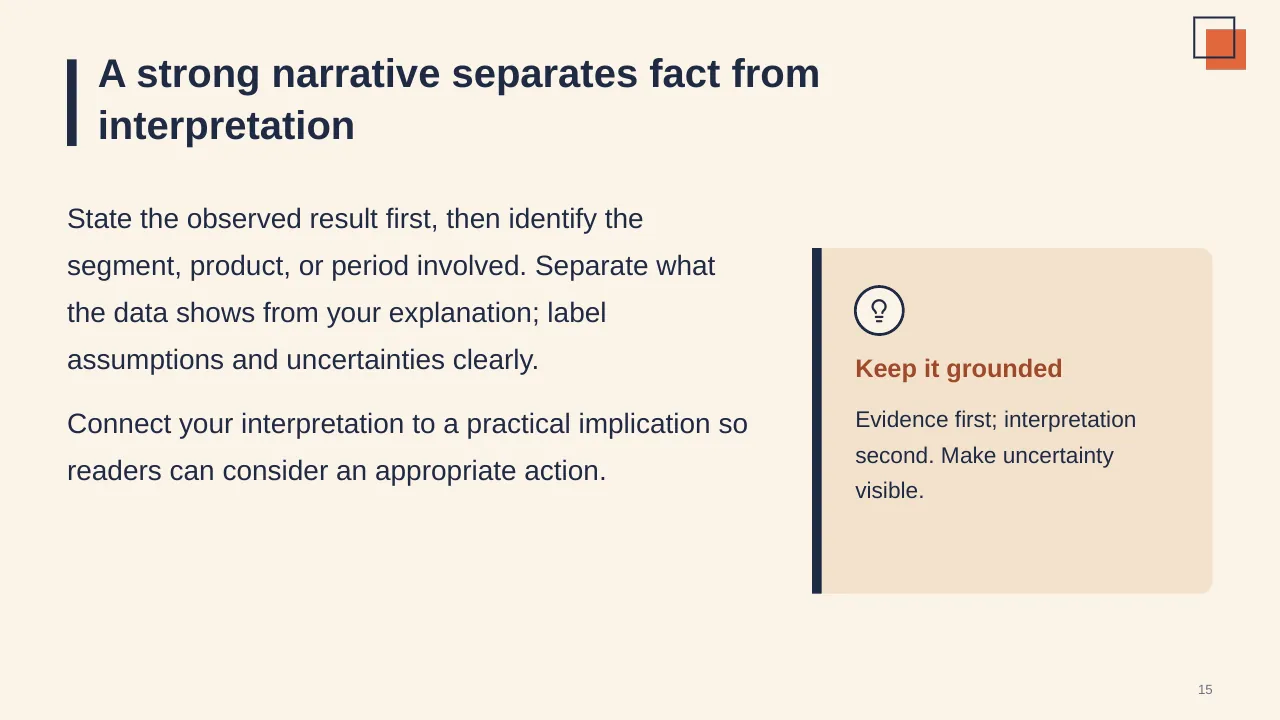
| 15 | State the observed result first, then identify the segment, product, or period involved. Separate what the… |
| 16 | Explain variances, prioritize findings, and keep follow-up visible. |
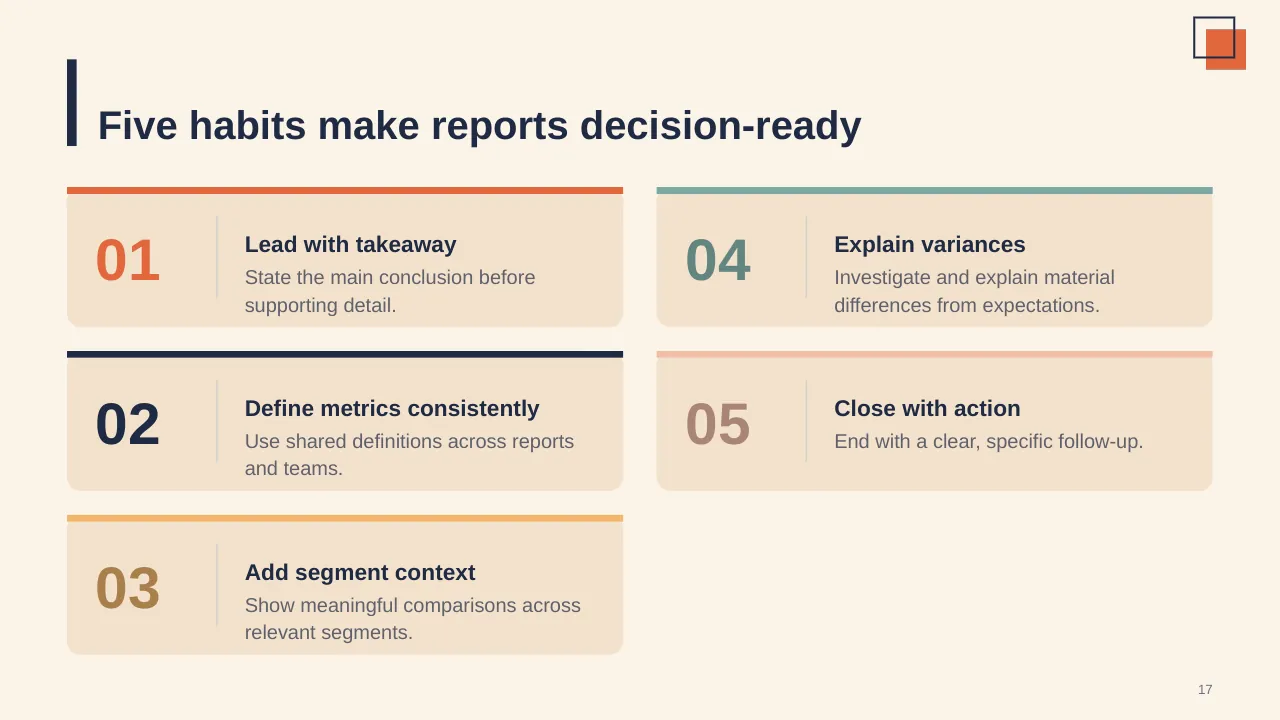
| 17 | Five habits make reports decision-ready |
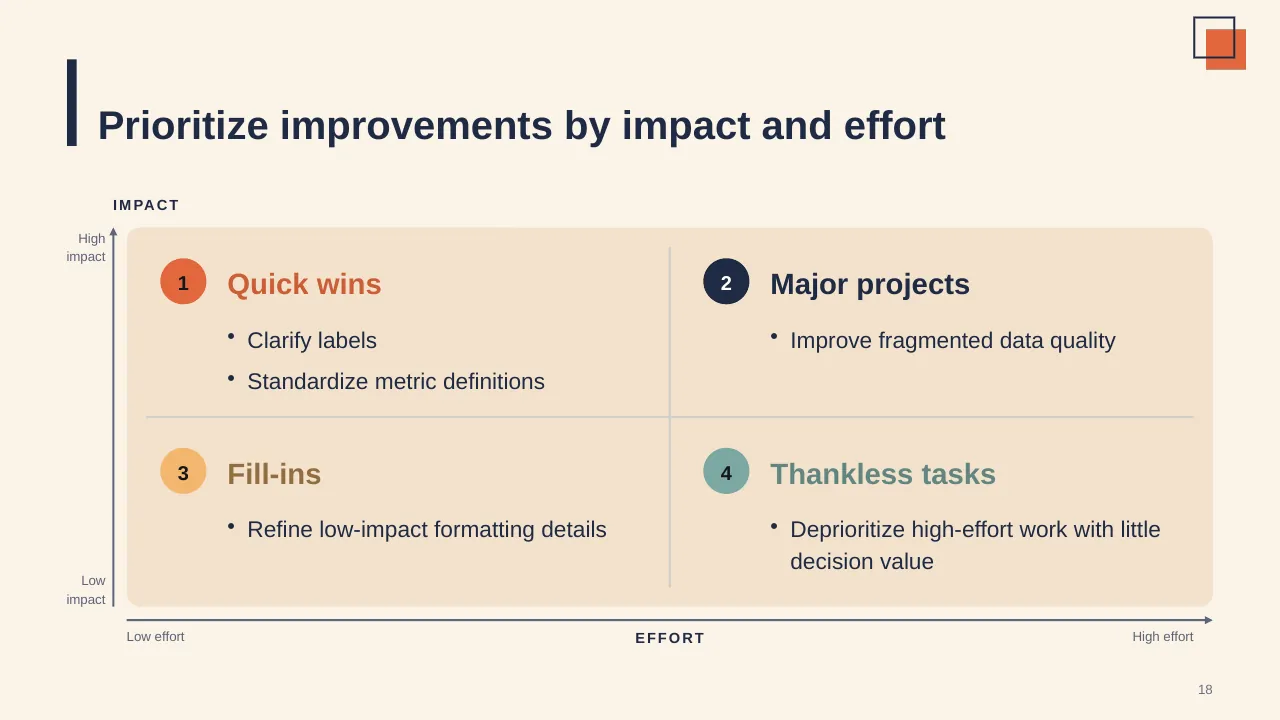
| 18 | Prioritize improvements by impact and effort |
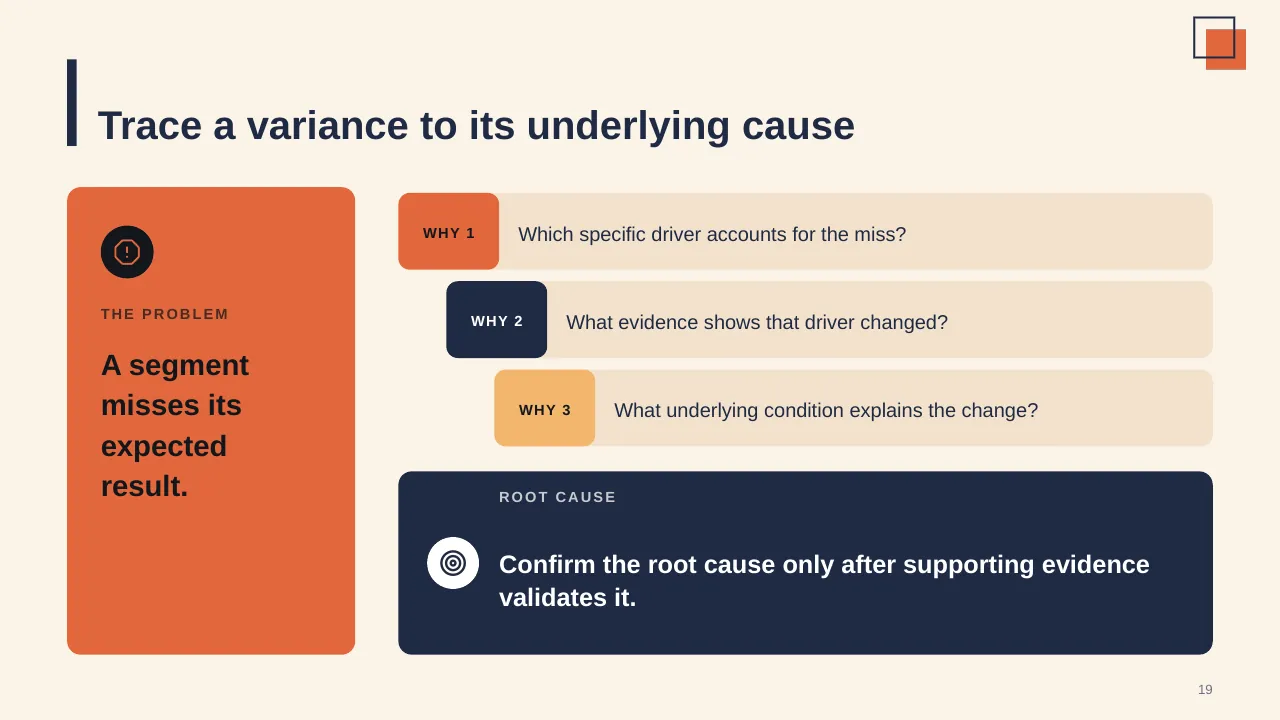
| 19 | Trace a variance to its underlying cause |
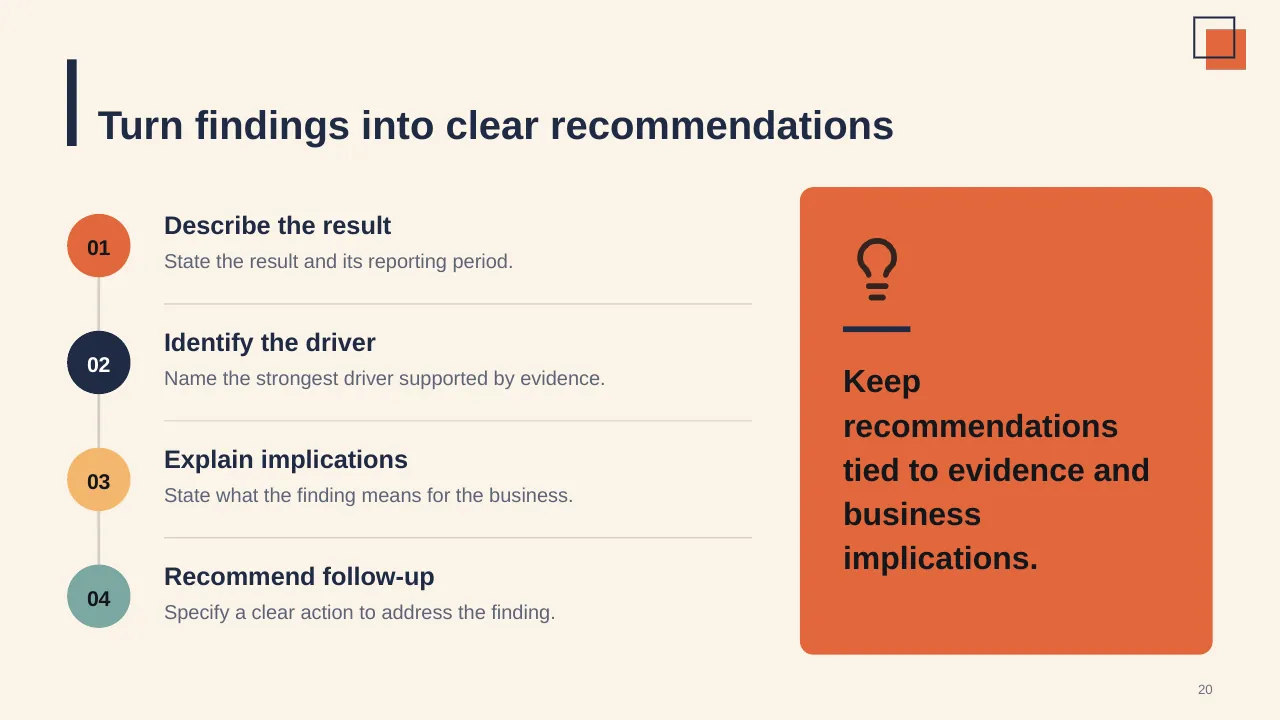
| 20 | Turn findings into clear recommendations |
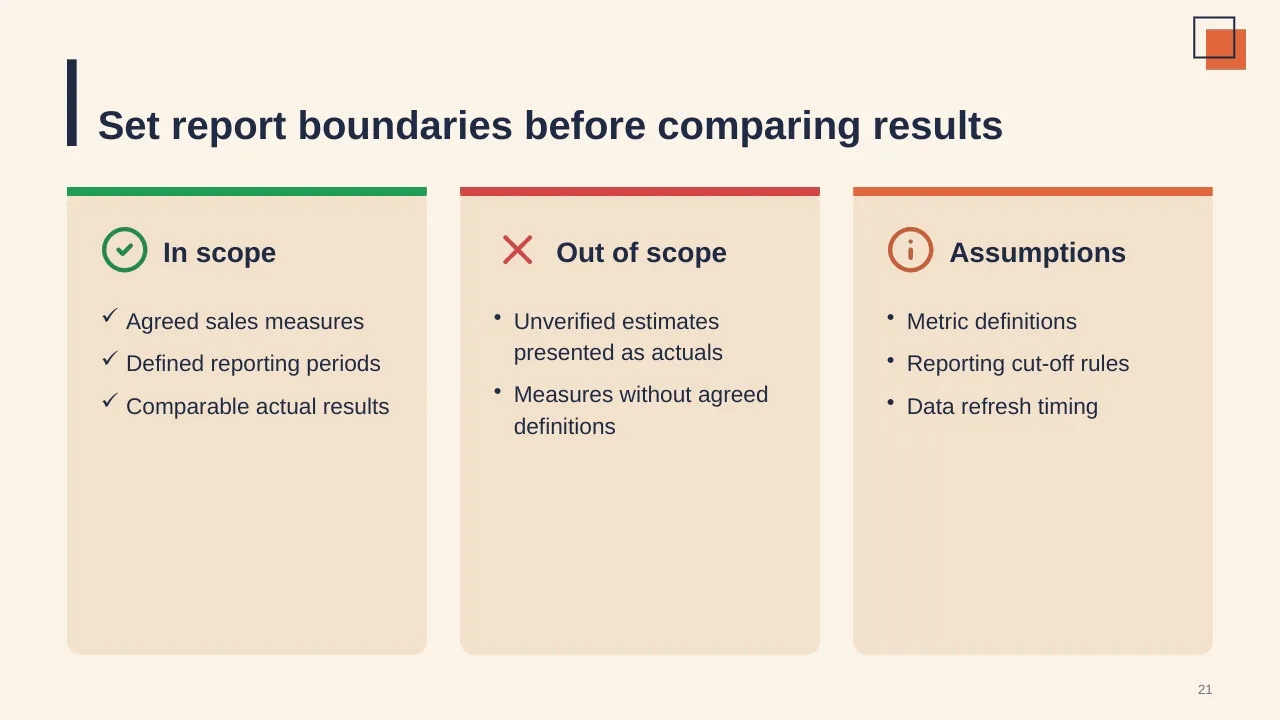
| 21 | Agreed sales measures Defined reporting periods Comparable actual results |
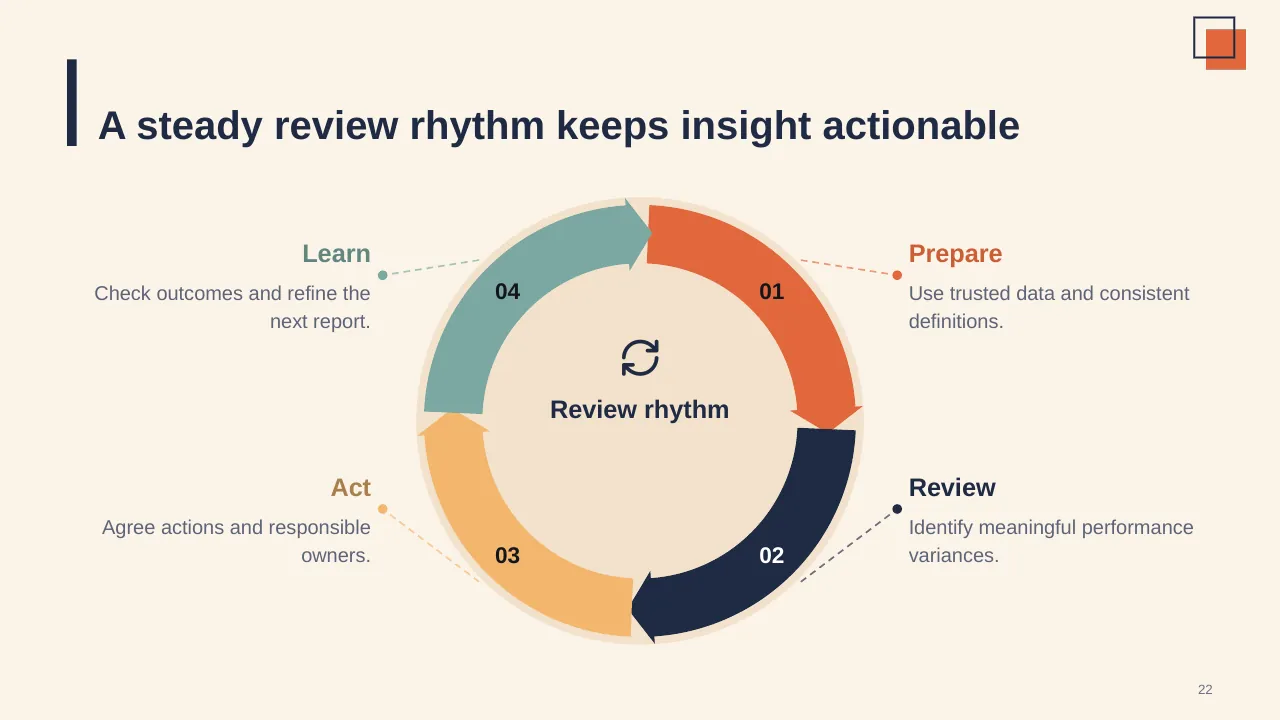
| 22 | A steady review rhythm keeps insight actionable |
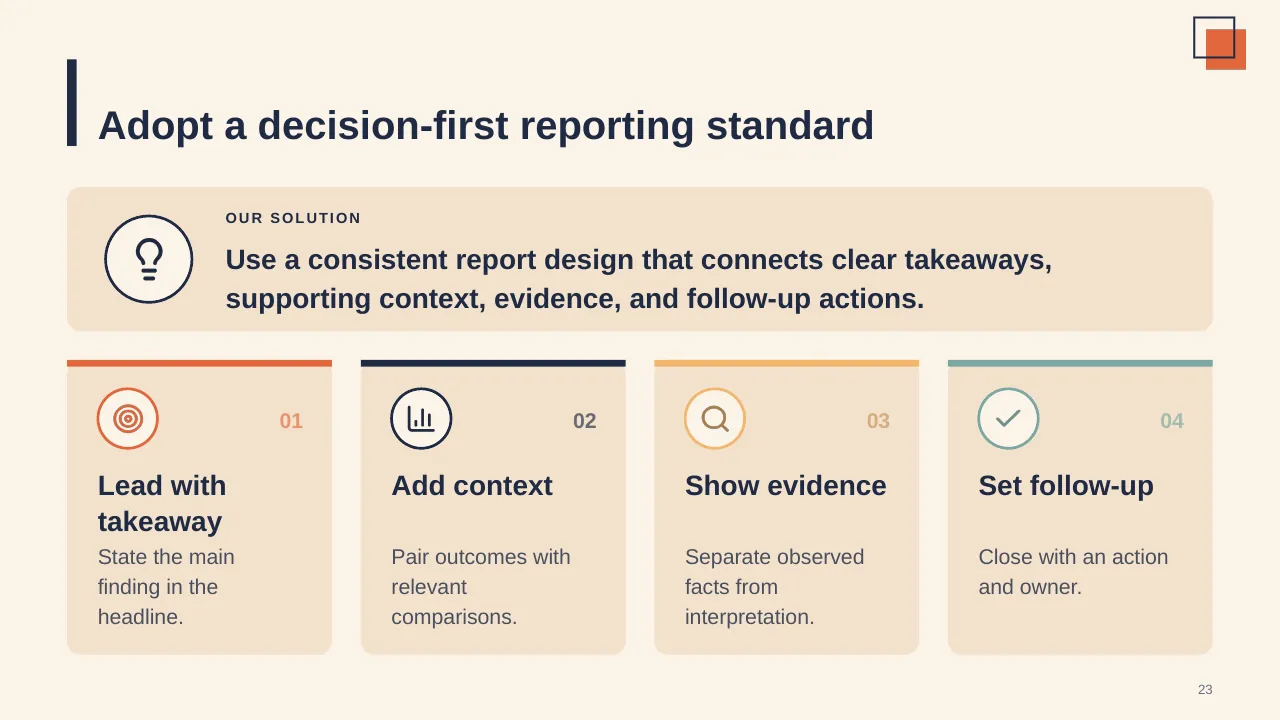
| 23 | Use a consistent report design that connects clear takeaways, supporting context, evidence, and follow-up… |
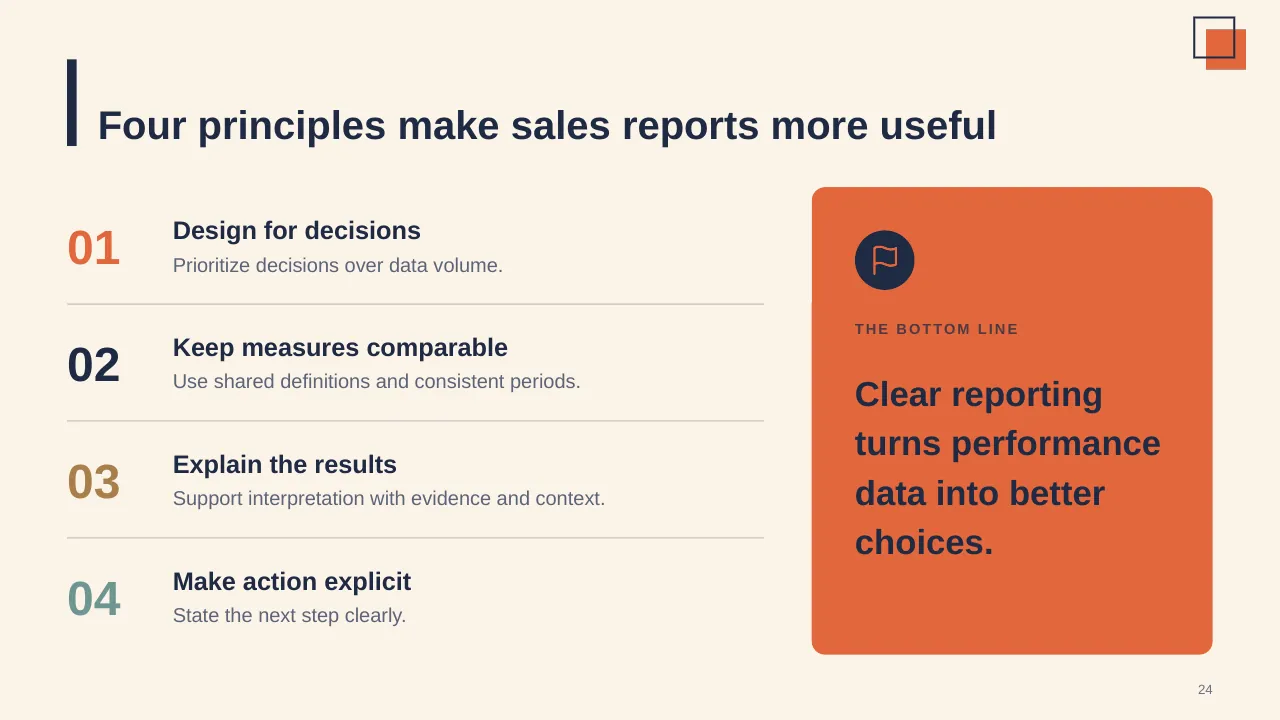
| 24 | Four principles make sales reports more useful |
| 25 | Choose a recurring report, clarify its decision, and agree on one action. |
Tips for a sales presentation
- Lead with the number vs target and the forecast.
- Salesforce found reps spend only about 28% of their week selling; show what you will remove to free up time.
- Explain variances by driver: volume, price, mix.
- Put the ask (resources, decisions) on its own slide.
Mistakes to avoid
- Charts with no comparison to target
- Pipeline without stage conversion
- No plan for next period
Checklist before you present
- Is revenue shown vs target and last period?
- Is pipeline coverage clear?
- Are variances explained?
- Are next-period targets set?
- Is the ask explicit?
Great for
- Sales reviews and forecasts
- Marketing and launch plans
- Customer experience programmes
- Competitive and market analysis
How to customise it
- Download the ZIP file and unzip it to get the .pptx presentation.
- Open it in PowerPoint, or upload it to Google Drive and open it with Google Slides.
- Replace the sample text and numbers with your own; charts update from their data sheets.
- Change the theme colours once to recolour the whole deck, then delete any slides you don't need.
Questions about a sales presentation
What is pipeline coverage?
The value of open pipeline divided by the remaining target. Many teams aim for 3x, but the right ratio depends on your win rate.
How should a quarterly sales review be structured?
Results vs target, pipeline and forecast, performance by segment, wins and losses, and the plan for next quarter.
Related presentations
- Product Feature Comparison Table PowerPoint Presentation
- Four Building Blocks of Customer Success PowerPoint Presentation
- Go-to-Market Strategy PowerPoint Presentation
- Monthly Sales Review PowerPoint Presentation
Browse all Sales, Marketing & Customer presentations or more business PowerPoint templates.
Template details
| Template | Sales Reports PowerPoint Template |
|---|---|
| Categories | Business PowerPoint Templates, Sales, Marketing & Customer |
| File format | PowerPoint (.pptx), delivered as a .zip file |
| Number of slides | 25 fully editable slides |
| File size | 2.5 MB |
| Slide size | 16:9 widescreen |
| Preview images | 25 |
| Editable | Yes: text, colours, shapes, icons and charts |
| Works with | PowerPoint 2010 and later, PowerPoint for Mac, Google Slides |
| Licence | Royalty-free, yours to keep using after your plan ends (terms of use apply) |
| Price | Included in every SlideVilla plan |
| Added | 10 Mar 2025 |
Questions about this template
Can I edit the Sales Reports PowerPoint Template?
Yes. Every part of the Sales Reports PowerPoint Template is made with native PowerPoint shapes and text boxes, so you can change the wording, colours, fonts and sizes, move or delete elements, and swap icons without losing quality.
Does the Sales Reports PowerPoint Template work in Google Slides?
Yes. Download the .zip file, unzip it to get the .pptx, upload it to Google Drive and open it with Google Slides. The layout, shapes and text stay editable there too.
Is the Sales Reports PowerPoint Template free?
It is a premium template, included in every SlideVilla plan together with the rest of the library. See plans and pricing.
What size and format is it?
It is a PPTX file in 16:9 widescreen format with 25 slides, 2.5 MB (downloaded as a .zip; unzip it to get the presentation), with 25 preview images shown above.
How to use this template
- Step 1DownloadClick Download, then unzip the .zip file to get the .pptx presentation.
- Step 2OpenOpen it in PowerPoint, or upload it to Google Slides from your Drive.
- Step 3Make it yoursChange text, colours, icons and charts. Every element is fully editable.
Related PowerPoint templates
More designs like this one, ready to edit.