
About this PowerPoint template
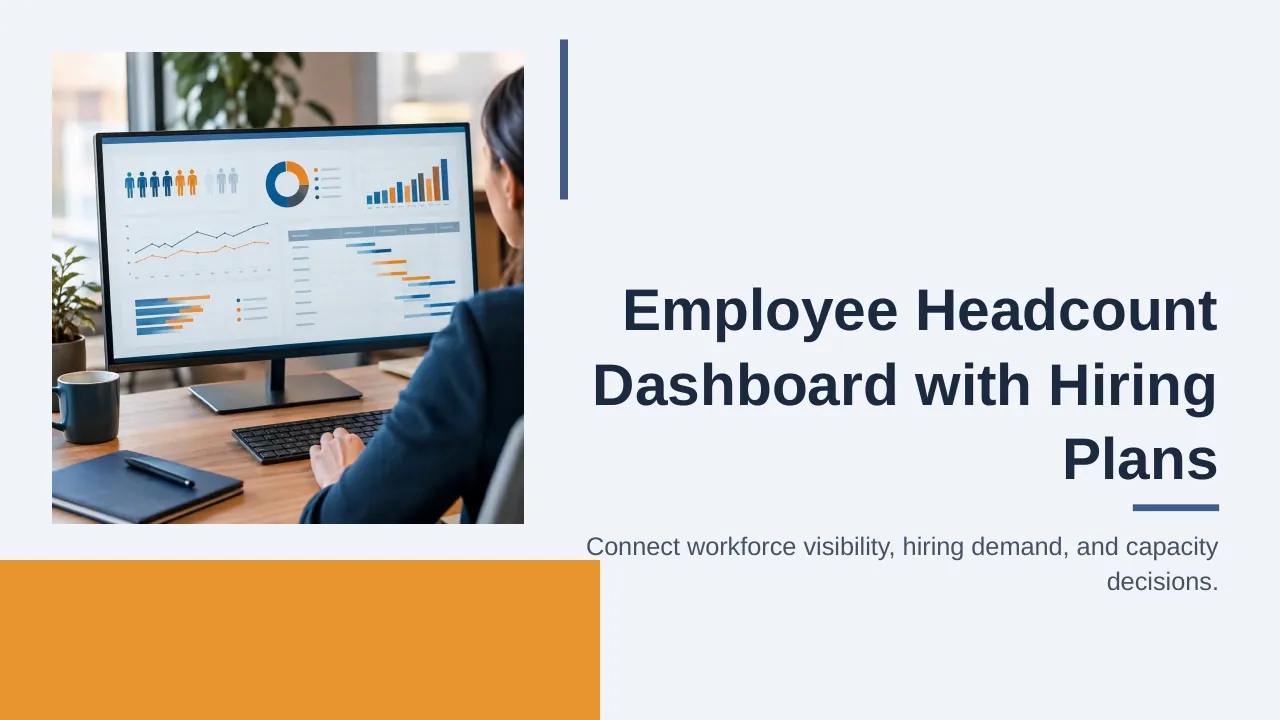
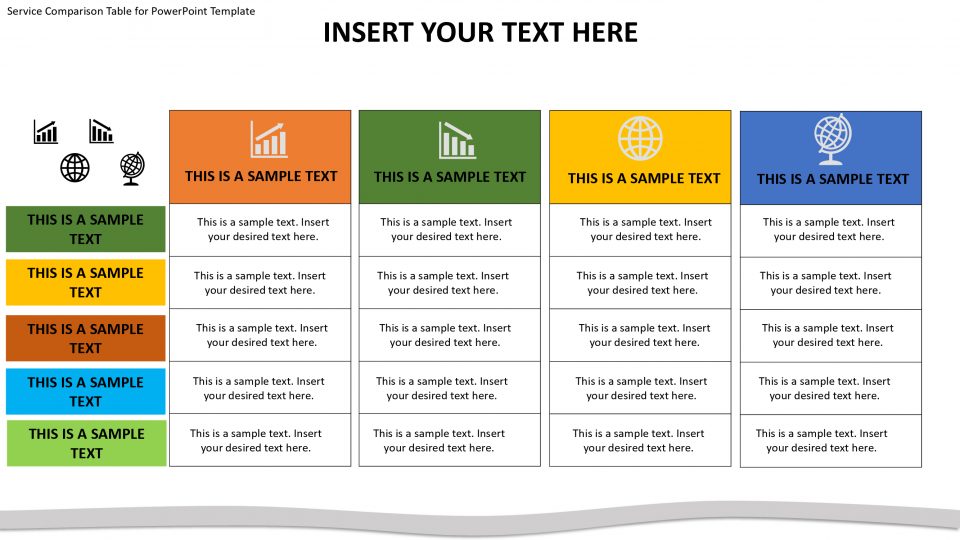
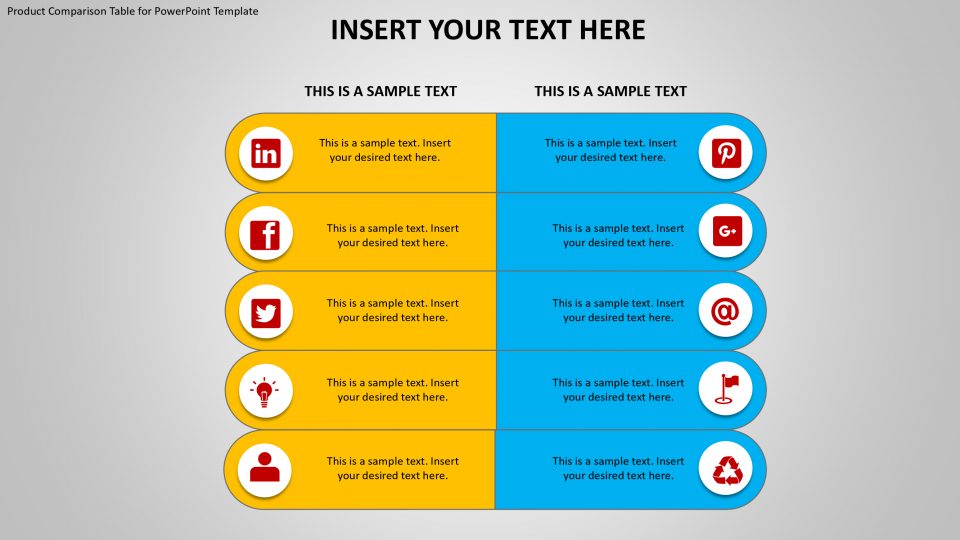
The Headcount Comparison PowerPoint Template is a complete 20-slide presentation: a practical approach to comparing workforce size and composition. Every slide is fully editable in PowerPoint and Google Slides, so you can change the text, colours, charts and icons to fit your brand in minutes.
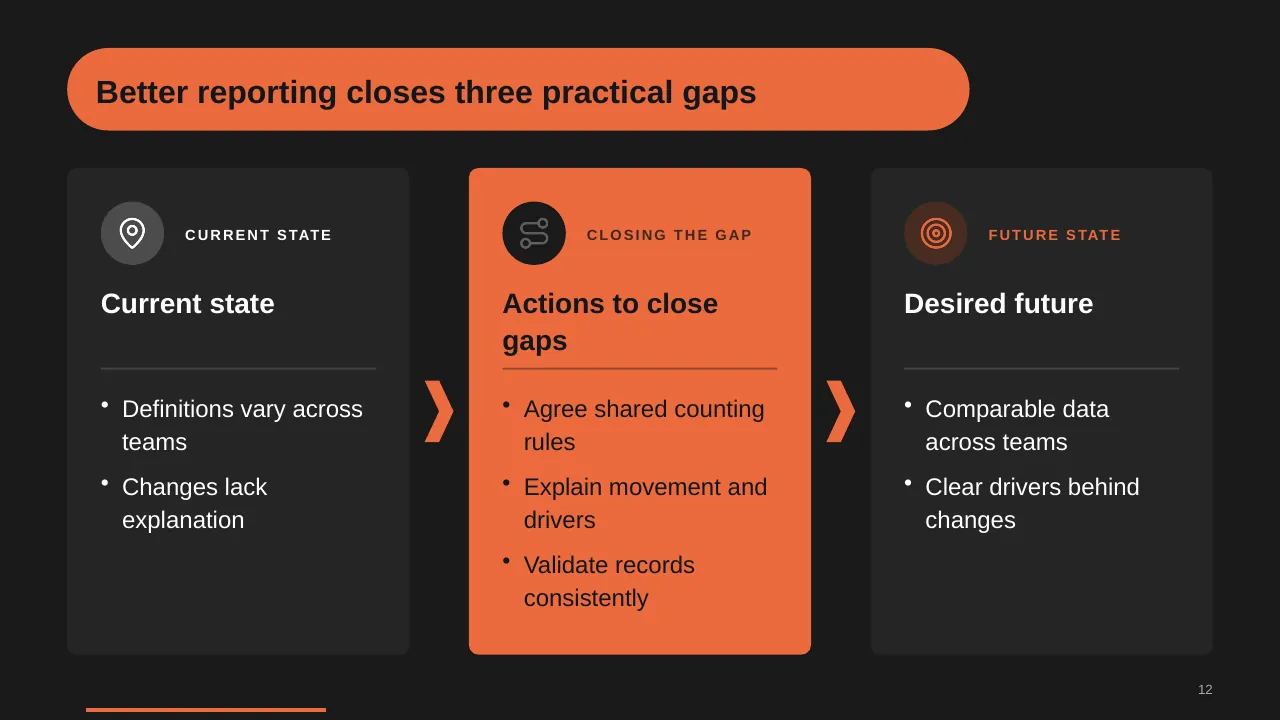
Inside, the slides walk through topics such as “Define the measures before comparing teams”, “Better reporting closes three practical gaps” and “Confirm the same workforce and snapshot date”, with ready-made layouts for each step. It is part of our KPI Dashboards presentations.
On this page
What's included
- 20 professionally designed 16:9 widescreen slides
- 100% editable text, shapes, icons, tables and charts (no flat images)
- Works in Microsoft PowerPoint (Windows and Mac) and Google Slides
- Clean, consistent layout that follows your theme colours and fonts
- Delivered as a single ZIP file containing the .pptx presentation
What to include in an HR presentation
A simple structure that works for most audiences, mapped to the slides in this deck:
| Part | What goes there | Slide in this deck |
|---|---|---|
| Context and goals | The people challenge and what you want to change | Use any content slide |
| Data and insights | Survey results, headcount, turnover or engagement | Slides 9, 14, 16 |
| Programmes | The initiatives, policies or training planned | Slide 6 |
| Roles and teams | Who owns what across HR and managers | Slides 4, 6, 11 |
| Measures | Engagement, retention and other KPIs | Slide 4 |
Key numbers: People and engagement
Research figures you can quote on your slides. Each one names the study it comes from, so your audience can check it.
| Finding | Figure | Source |
|---|---|---|
| Employees engaged at work worldwide, 2025 | 20% (peak 23% in 2022) | Gallup, State of the Global Workplace (2026) |
| Manager engagement, 2025 | 22% (from 27%) | Gallup, State of the Global Workplace (2026) |
| Cost of low engagement to the global economy | about $10 trillion (9% of GDP) | Gallup, State of the Global Workplace (2026) |
| Share of a team's engagement linked to its manager | 70% | Gallup, State of the Global Workplace (2025) |
Sources: Gallup press release, April 2026 · Gallup, State of the Global Workplace · Allwork.Space on the 2025 report. Figures are from the editions named; check for a newer edition before you present.
Slide-by-slide outline
| Slide | What it covers |
|---|---|
| 1 | Title slide: Headcount Comparison |
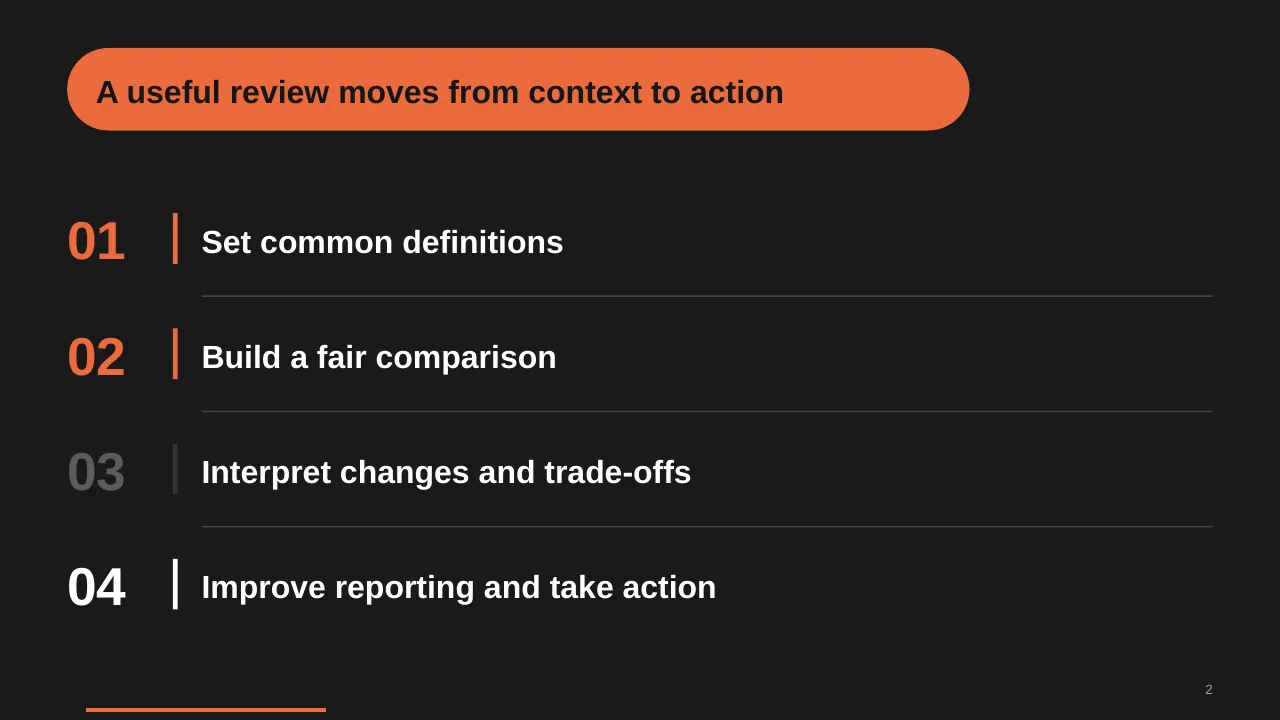
| 2 | A useful review moves from context to action |
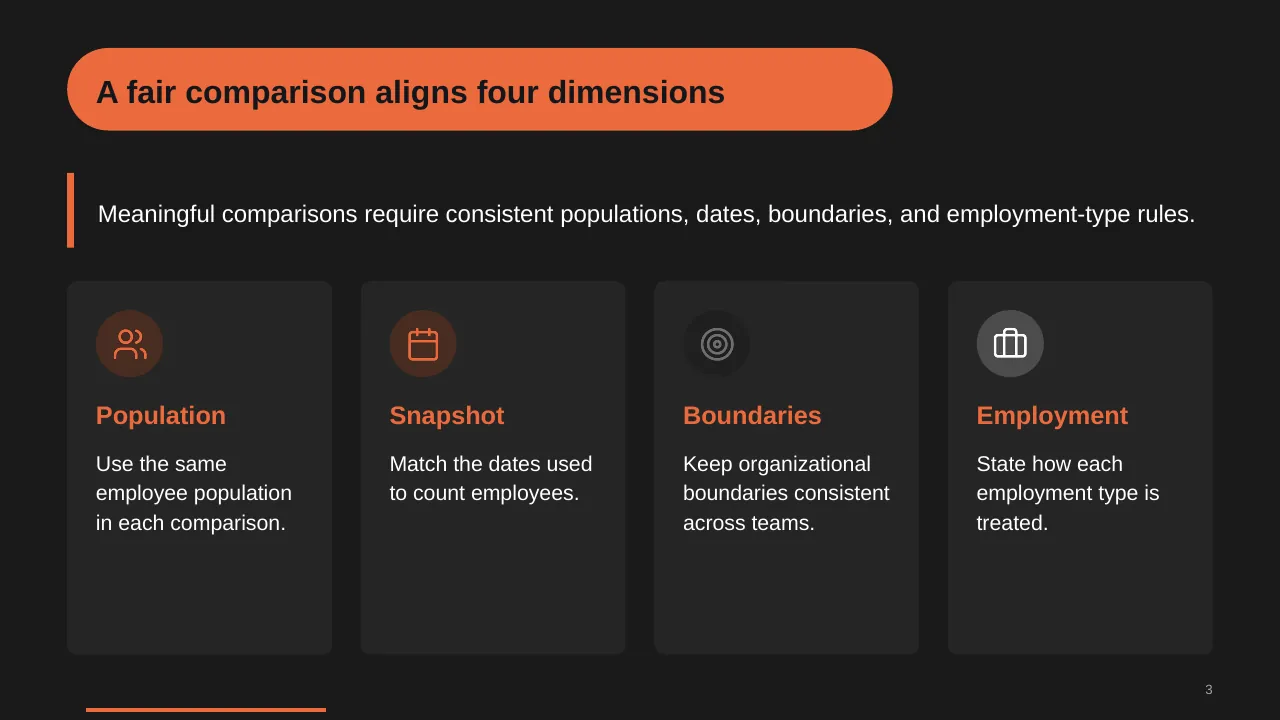
| 3 | Meaningful comparisons require consistent populations, dates, boundaries, and employment-type rules. |
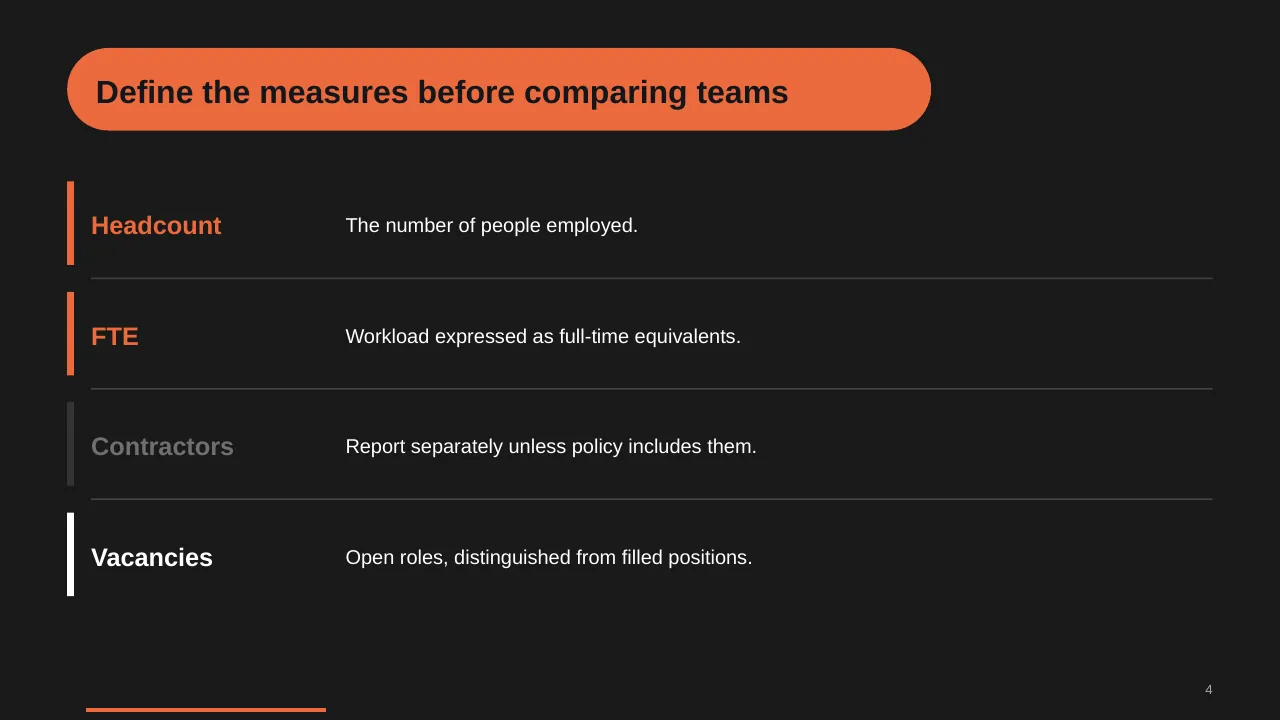
| 4 | Define the measures before comparing teams |
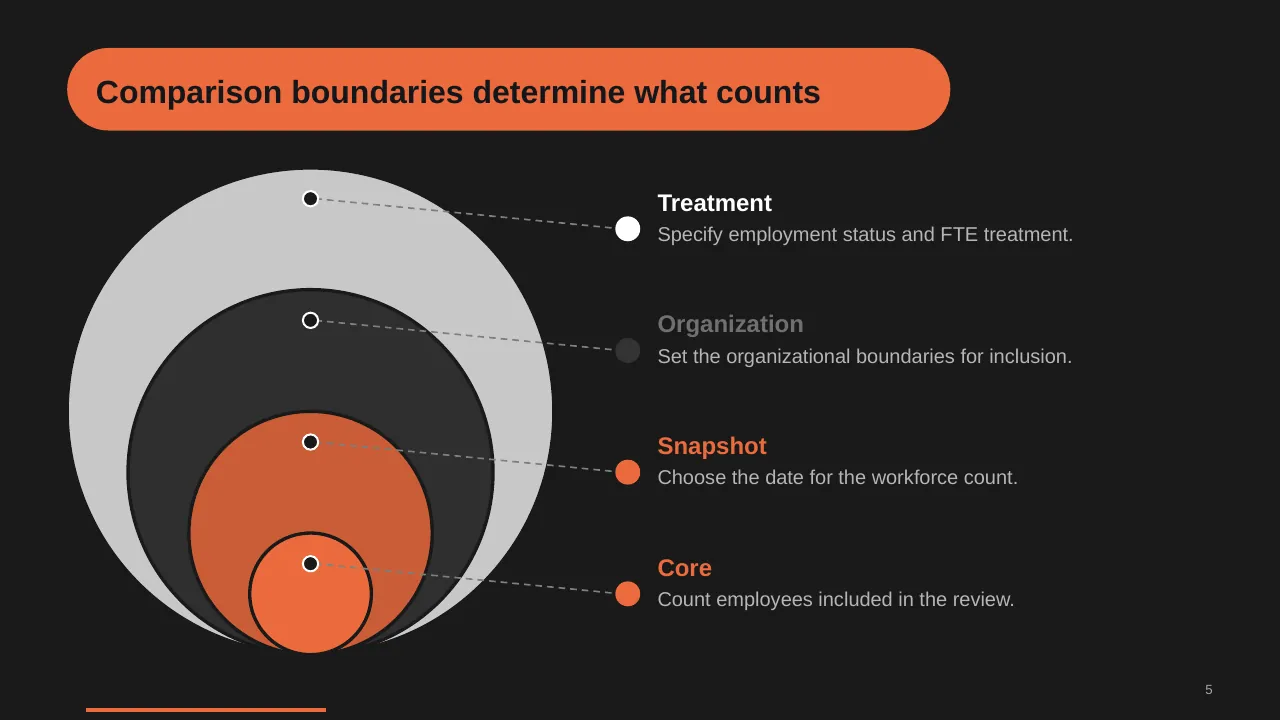
| 5 | Comparison boundaries determine what counts |
| 6 | The sample plan adds five roles net |
| 7 | Trace functional changes, capacity, and the drivers behind workforce movement. |
| 8 | Part-time work, vacancies, and contractors shape capacity beyond employee counts. |
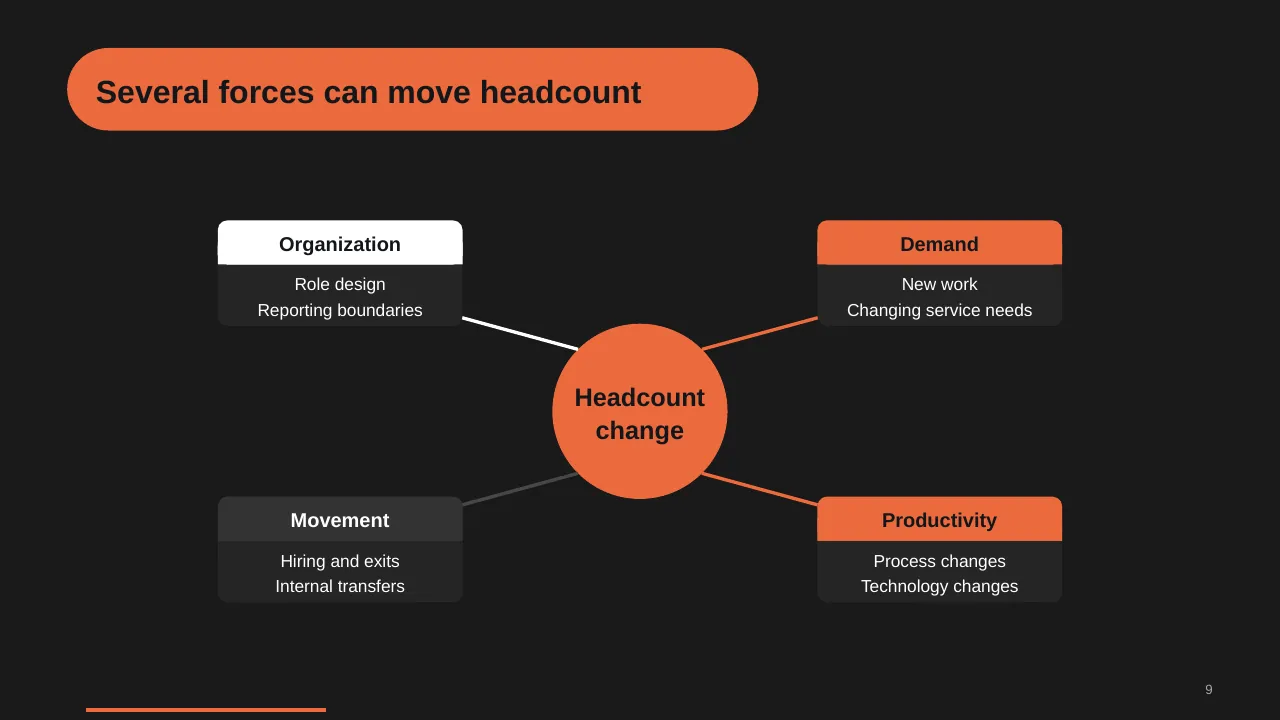
| 9 | Several forces can move headcount |
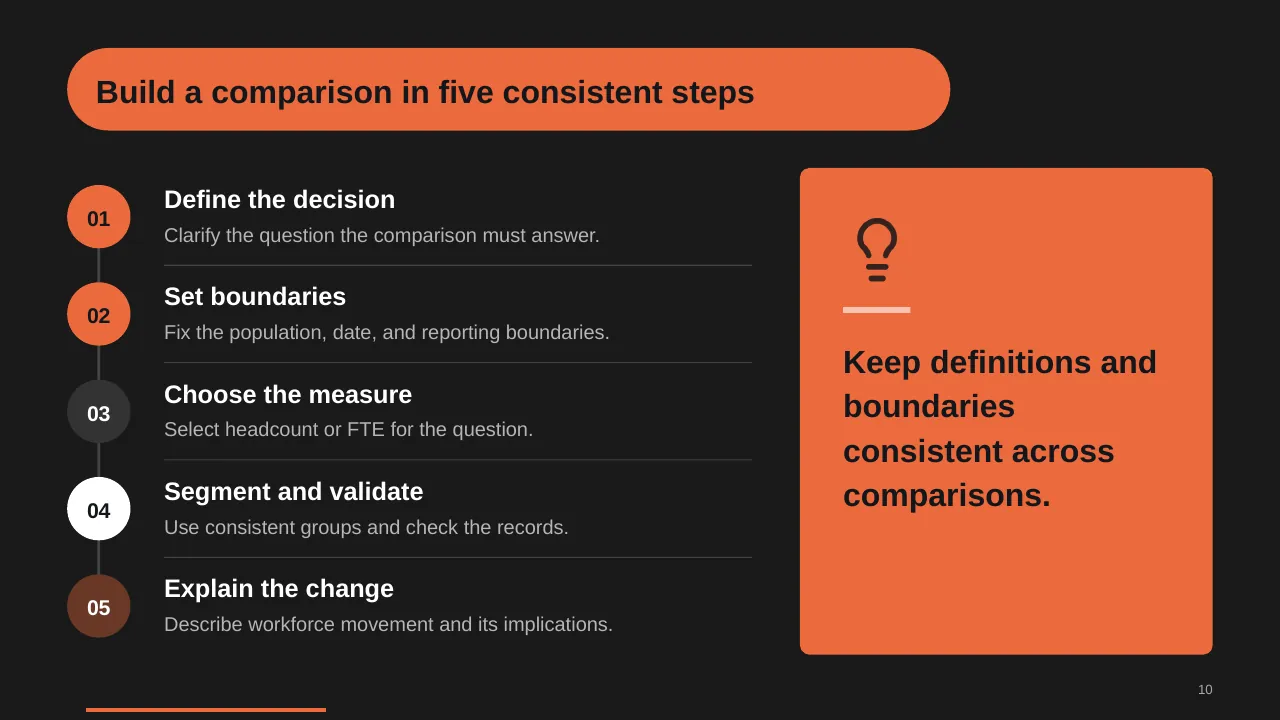
| 10 | Build a comparison in five consistent steps |
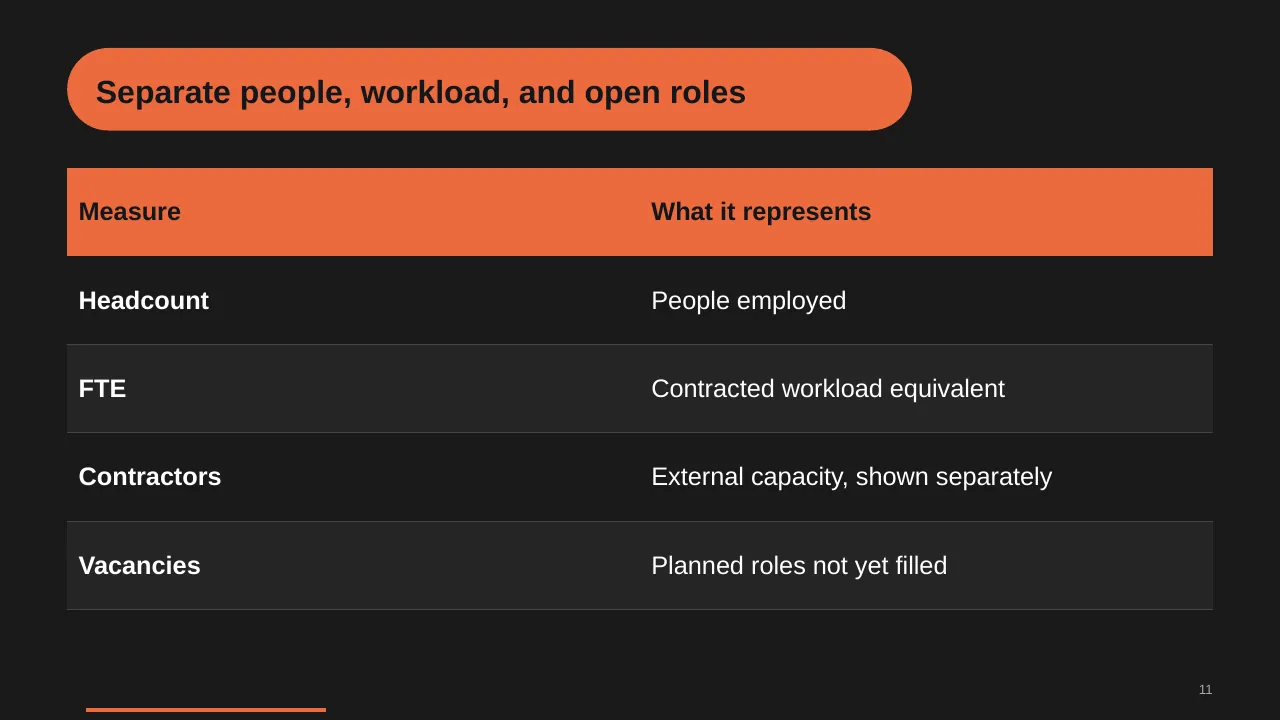
| 11 | Separate people, workload, and open roles |
| 12 | Better reporting closes three practical gaps |
| 13 | Translate evidence into practical choices that balance service needs, affordability, and visible assumptions. |
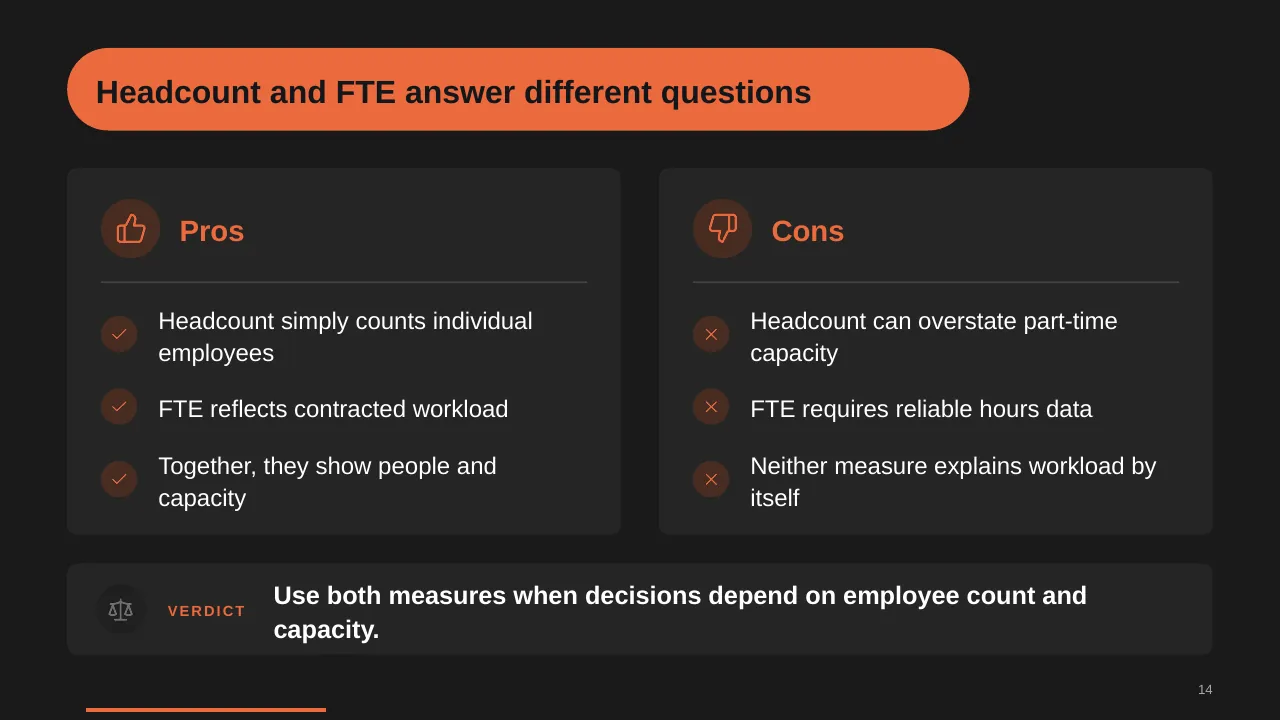
| 14 | Headcount and FTE answer different questions |
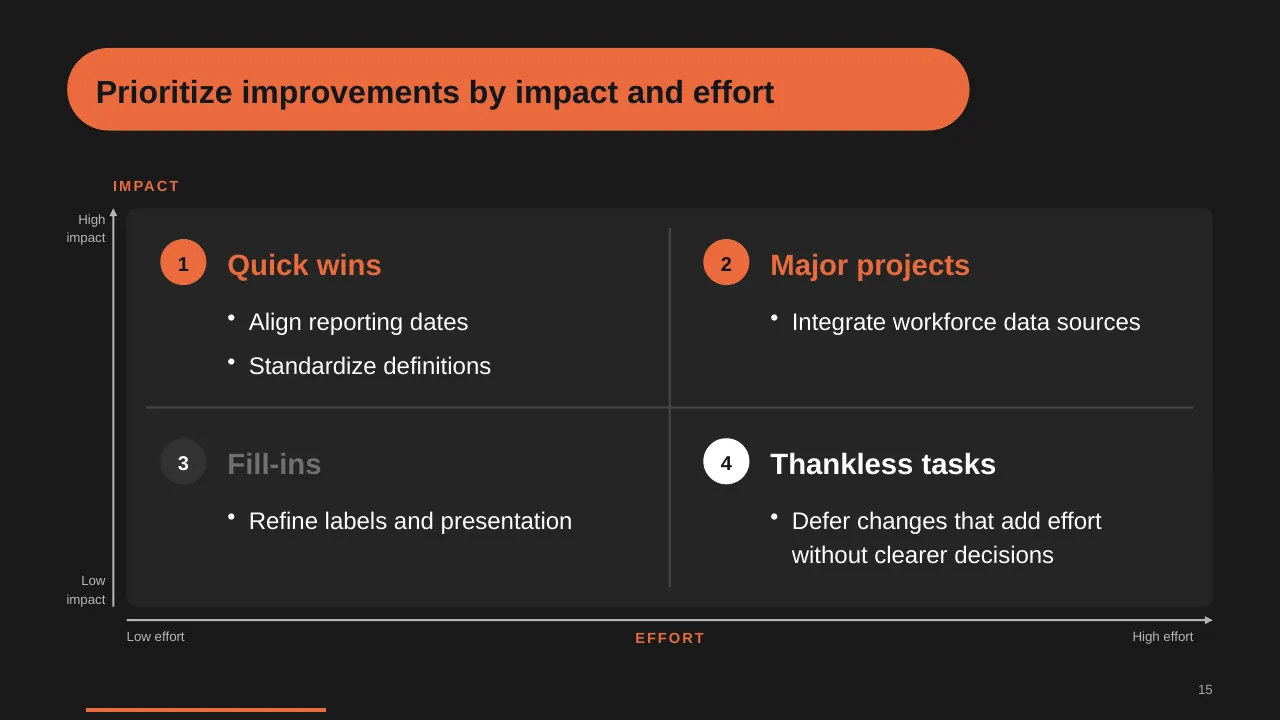
| 15 | Prioritize improvements by impact and effort |
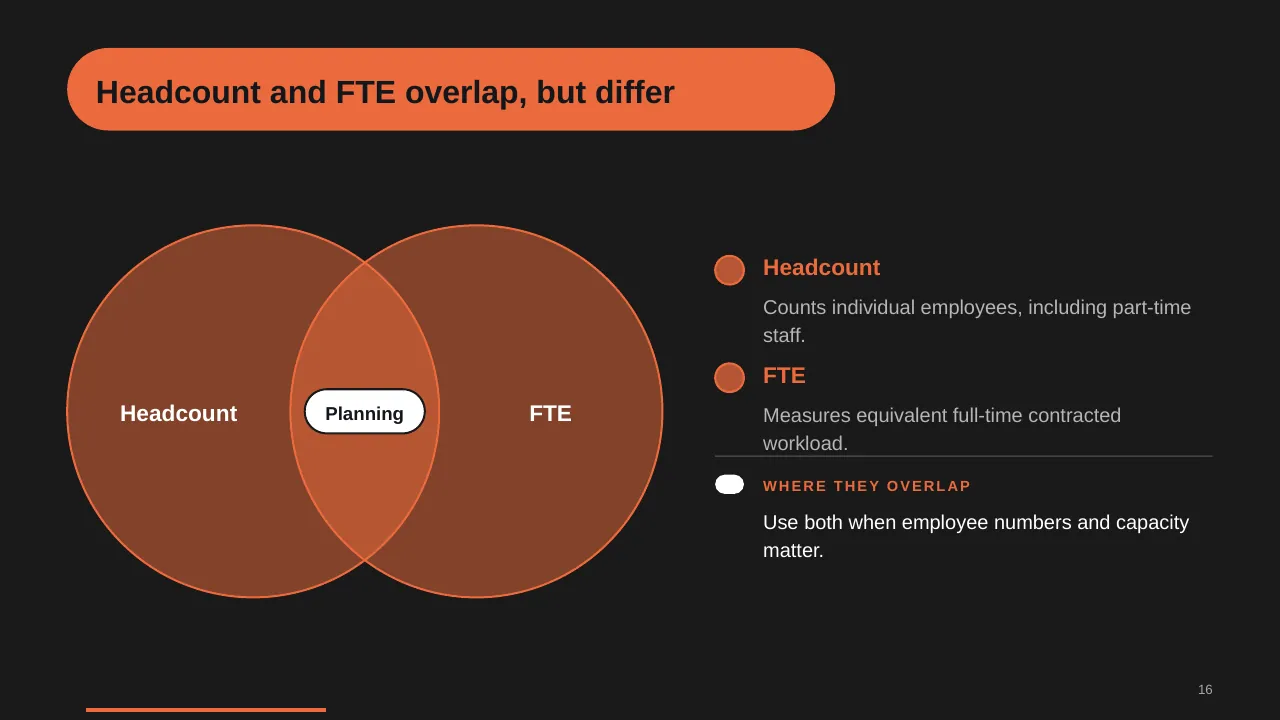
| 16 | Headcount and FTE overlap, but differ |
| 17 | Standardize definitions, ownership, and refresh intervals. |
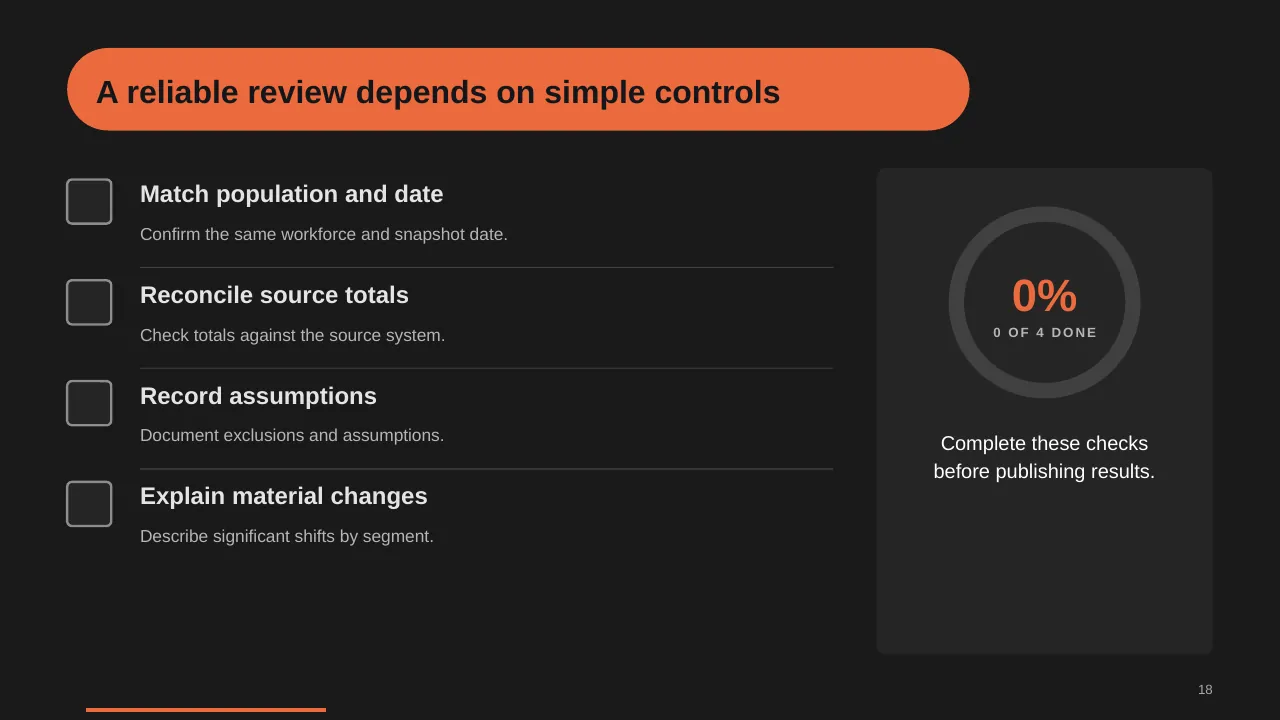
| 18 | Confirm the same workforce and snapshot date. |
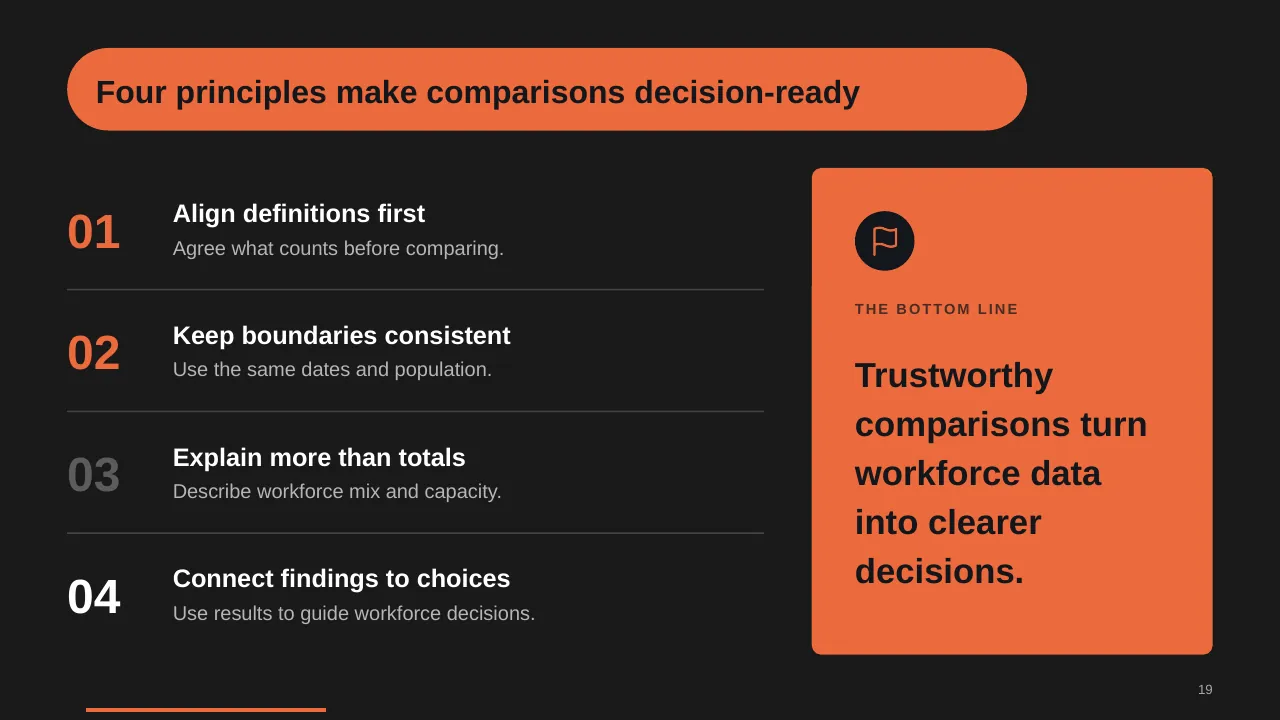
| 19 | Four principles make comparisons decision-ready |
| 20 | Agree on the question and counting rules, then use results to guide workforce decisions. |
Tips for an HR presentation
- Start with one people metric that matters to the business, such as regretted attrition.
- Managers drive about 70% of team engagement, so show what managers will do differently.
- Use anonymised quotes from surveys next to the numbers.
- Close with clear owners and dates.
Mistakes to avoid
- Too many initiatives at once
- Survey results with no action plan
- No manager involvement
Checklist before you present
- Is the people problem stated clearly?
- Are data sources and dates shown?
- Does each programme have an owner?
- Are managers' actions spelled out?
- Are KPIs and review dates set?
Great for
- Monthly performance reviews
- Management and board reporting
- Project and portfolio tracking
- HR, finance and operations metrics
How to customise it
- Download the ZIP file and unzip it to get the .pptx presentation.
- Open it in PowerPoint, or upload it to Google Drive and open it with Google Slides.
- Replace the sample text and numbers with your own; charts update from their data sheets.
- Change the theme colours once to recolour the whole deck, then delete any slides you don't need.
Questions about an HR presentation
What should an HR strategy presentation include?
Business context, people priorities, key programmes, the operating model, a budget, and the KPIs you will report.
How do I present employee survey results?
Show response rate, top strengths, top gaps, and two or three actions with owners, then report back on progress.
Related presentations
- Risk Management Dashboard PowerPoint Template
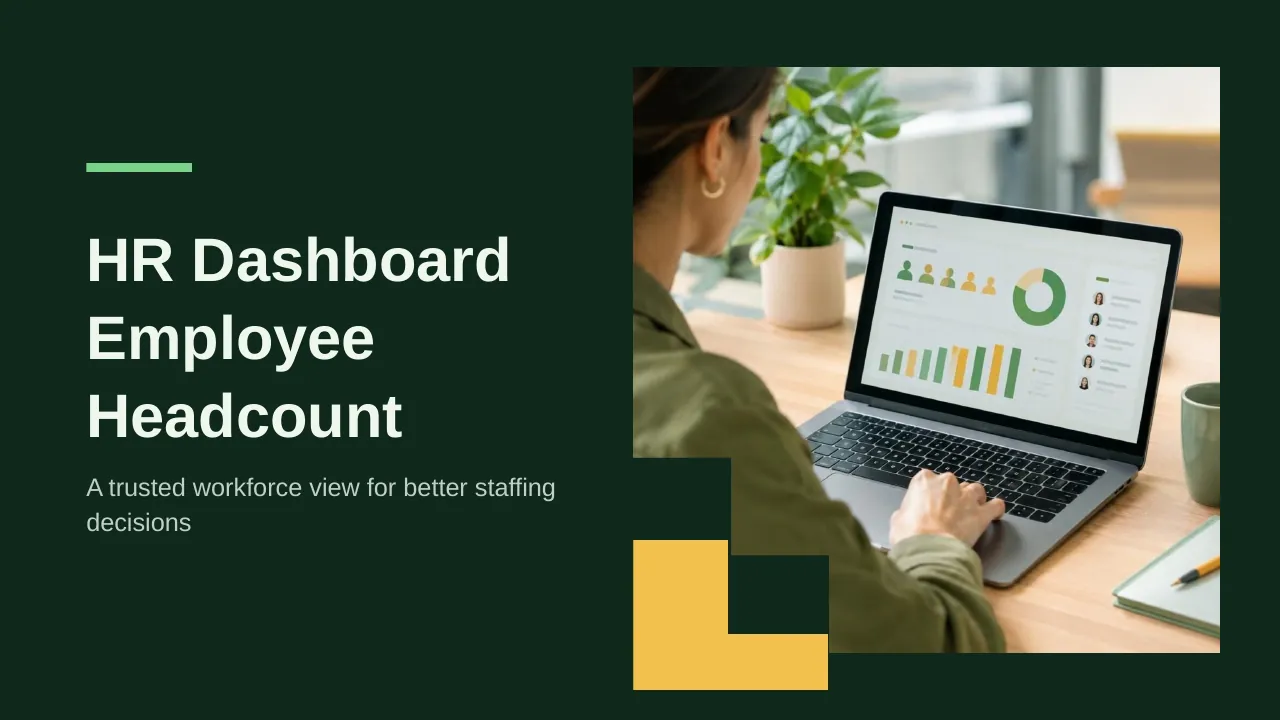
- HR Dashboard Employee Headcount PowerPoint Template
- Purchase Orders and Cost Reduction Dashboard PowerPoint Template
- Business KPI Dashboard Snapshot PowerPoint Template
Browse all KPI Dashboards presentations or more dashboard templates.
Template details
| Template | Headcount Comparison PowerPoint Template |
|---|---|
| Categories | Dashboards, KPI Dashboards |
| File format | PowerPoint (.pptx), delivered as a .zip file |
| Number of slides | 20 fully editable slides |
| File size | 2.2 MB |
| Slide size | 16:9 widescreen |
| Preview images | 20 |
| Editable | Yes: text, colours, shapes, icons and charts |
| Works with | PowerPoint 2010 and later, PowerPoint for Mac, Google Slides |
| Licence | Royalty-free, yours to keep using after your plan ends (terms of use apply) |
| Price | Included in every SlideVilla plan |
| Added | 10 Feb 2025 |
Questions about this template
Can I edit the Headcount Comparison PowerPoint Template?
Yes. Every part of the Headcount Comparison PowerPoint Template is made with native PowerPoint shapes and text boxes, so you can change the wording, colours, fonts and sizes, move or delete elements, and swap icons without losing quality.
Does the Headcount Comparison PowerPoint Template work in Google Slides?
Yes. Download the .zip file, unzip it to get the .pptx, upload it to Google Drive and open it with Google Slides. The layout, shapes and text stay editable there too.
Is the Headcount Comparison PowerPoint Template free?
It is a premium template, included in every SlideVilla plan together with the rest of the library. See plans and pricing.
What size and format is it?
It is a PPTX file in 16:9 widescreen format with 20 slides, 2.2 MB (downloaded as a .zip; unzip it to get the presentation), with 20 preview images shown above.
How to use this template
- Step 1DownloadClick Download, then unzip the .zip file to get the .pptx presentation.
- Step 2OpenOpen it in PowerPoint, or upload it to Google Slides from your Drive.
- Step 3Make it yoursChange text, colours, icons and charts. Every element is fully editable.
Categories
Tags
Related PowerPoint templates
More designs like this one, ready to edit.