About this PowerPoint template
The Functional Org Chart PPT Template is a complete 30-slide presentation: a practical guide to structuring work around expertise. Every slide is fully editable in PowerPoint and Google Slides, so you can change the text, colours, charts and icons to fit your brand in minutes.
Inside, the slides walk through topics such as “It supports role decisions and shows where issues can be escalated”, “Shared work sits at function interfaces” and “Structure alone cannot resolve operating friction”, with ready-made layouts for each step. It is part of our HR & People Management presentations.
On this page
What's included
- 30 professionally designed 16:9 widescreen slides
- 100% editable text, shapes, icons, tables and charts (no flat images)
- Works in Microsoft PowerPoint (Windows and Mac) and Google Slides
- Clean, consistent layout that follows your theme colours and fonts
- Delivered as a single ZIP file containing the .pptx presentation
What to include in a leadership or team presentation
A simple structure that works for most audiences, mapped to the slides in this deck:
| Part | What goes there | Slide in this deck |
|---|---|---|
| Purpose | Why the team or structure exists | Use any content slide |
| Structure | Org chart, reporting lines and roles | Slides 2, 3, 4 |
| Responsibilities | Who decides and who does | Slides 3, 4 |
| Capabilities | Skills and competencies needed | Use any content slide |
| Ways of working | Meetings, communication and support | Slides 4, 19 |
Key numbers: Leadership
Research figures you can quote on your slides. Each one names the study it comes from, so your audience can check it.
| Finding | Figure | Source |
|---|---|---|
| Leaders reporting increased stress | 71% (from 63% in 2022) | DDI Global Leadership Forecast (2025) |
| Stressed leaders who have considered leaving | 40% | DDI Global Leadership Forecast (2025) |
| Leaders who trust their senior leaders | 32% | DDI Global Leadership Forecast (2025) |
| HR leaders with successors ready for critical roles | 20% | DDI HR Insights Report (2025) |
| Share of a team's engagement linked to its manager | 70% | Gallup, State of the Global Workplace (2025) |
Sources: DDI Global Leadership Forecast 2025 (PDF) · DDI HR Insights Report 2025 · Gallup, State of the Global Workplace. Figures are from the editions named; check for a newer edition before you present.
Slide-by-slide outline
| Slide | What it covers |
|---|---|
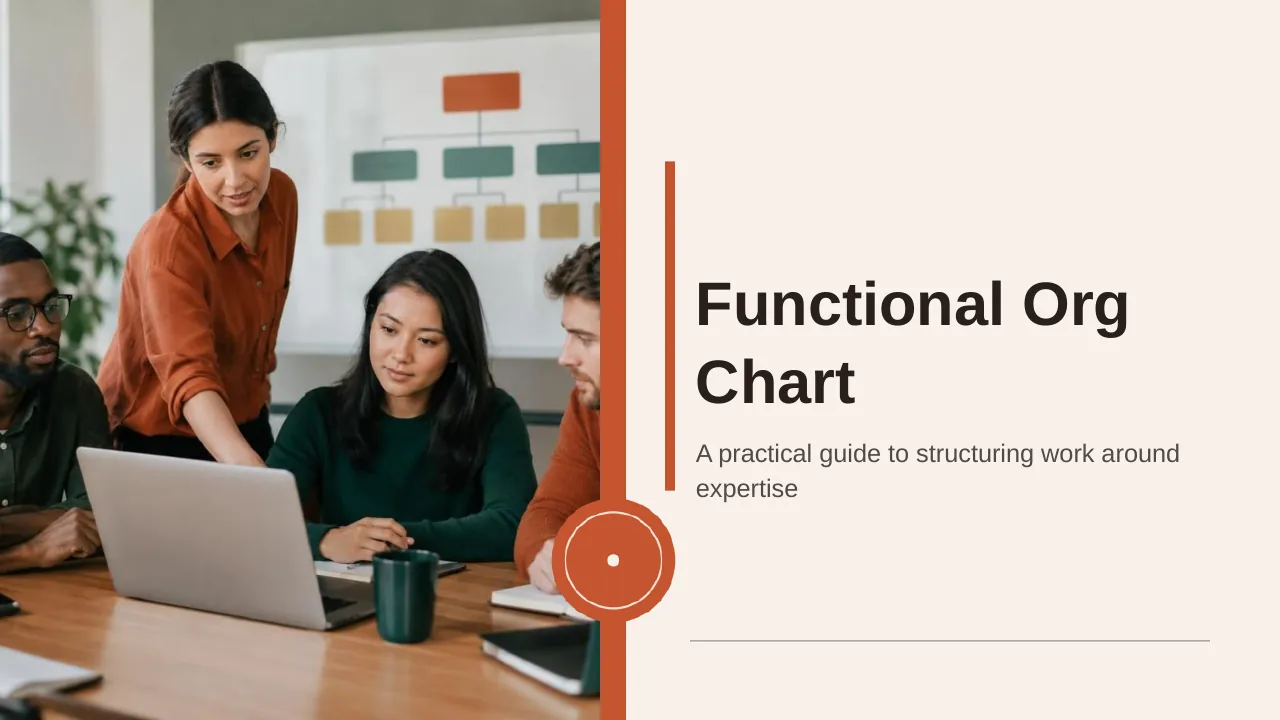
| 1 | Title slide: Functional Org Chart |
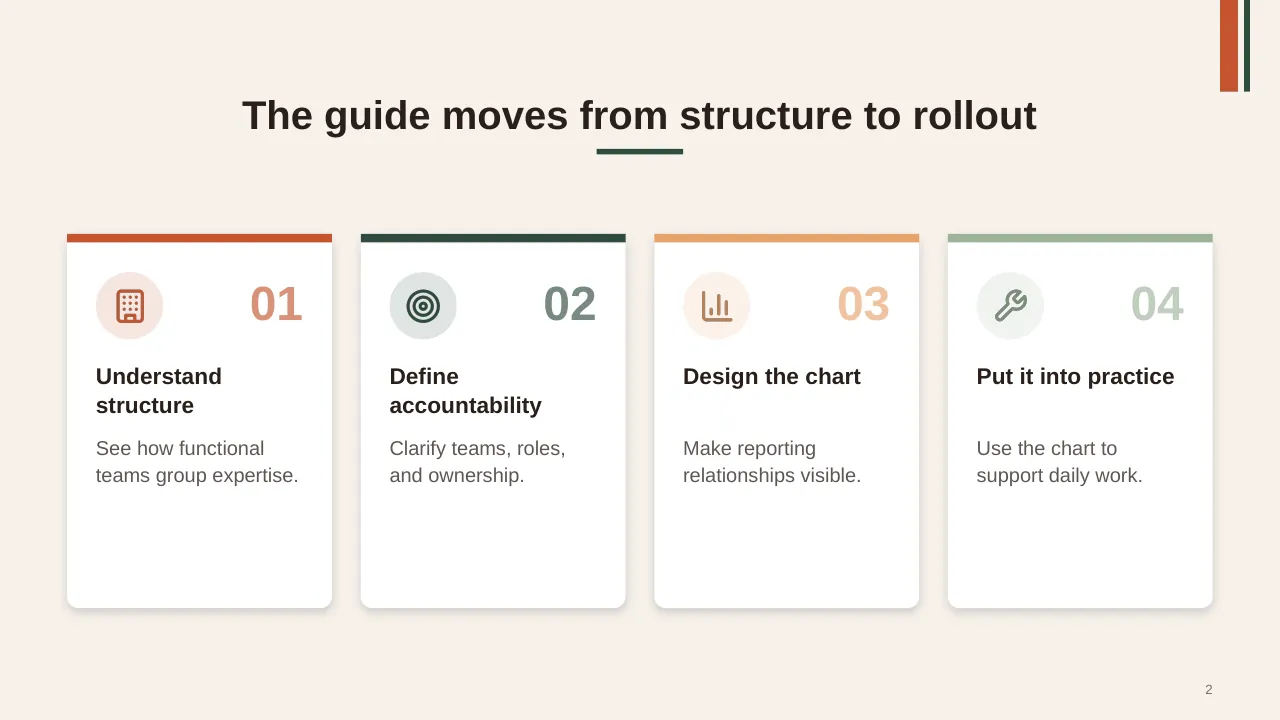
| 2 | The guide moves from structure to rollout |
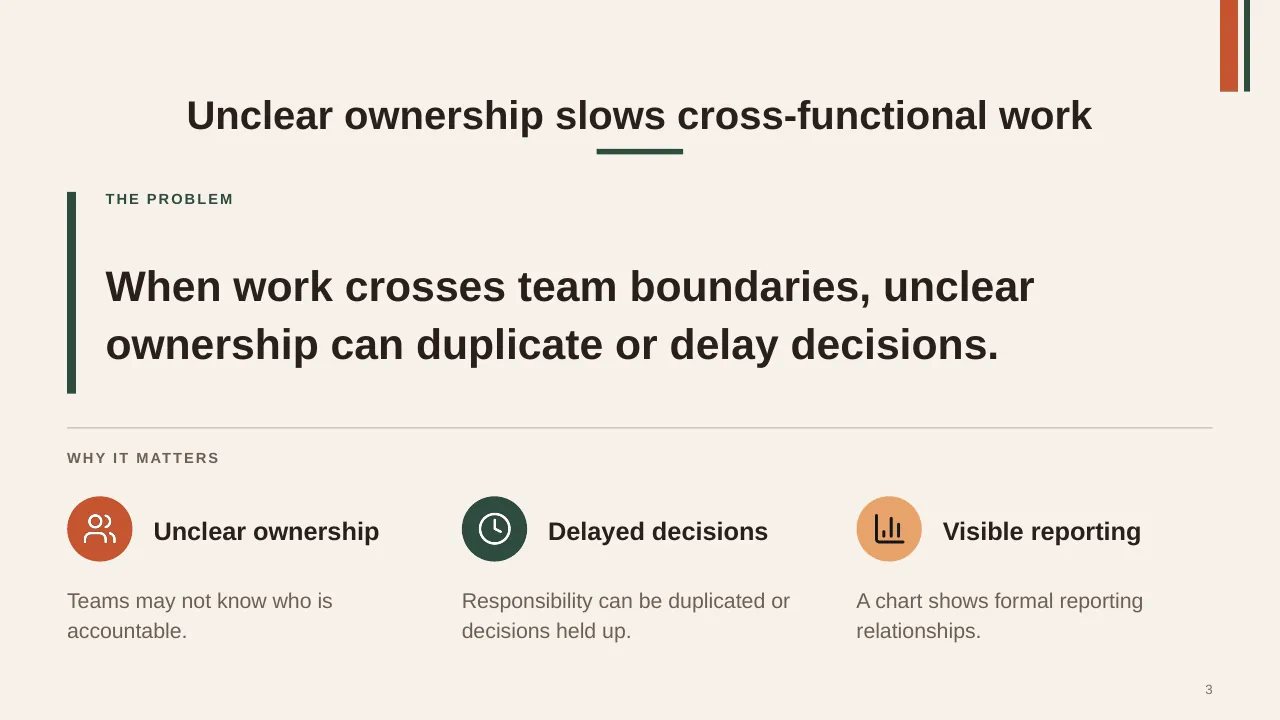
| 3 | When work crosses team boundaries, unclear ownership can duplicate or delay decisions. |
| 4 | It supports role decisions and shows where issues can be escalated. |
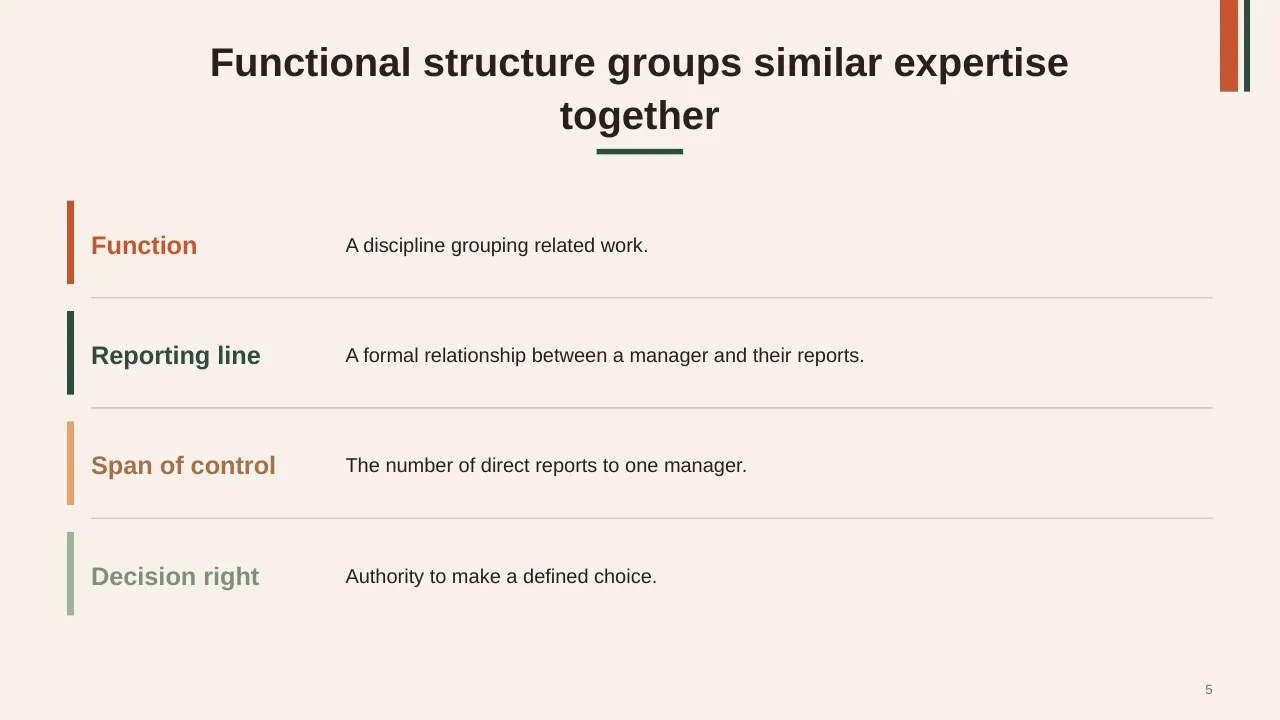
| 5 | Functional structure groups similar expertise together |
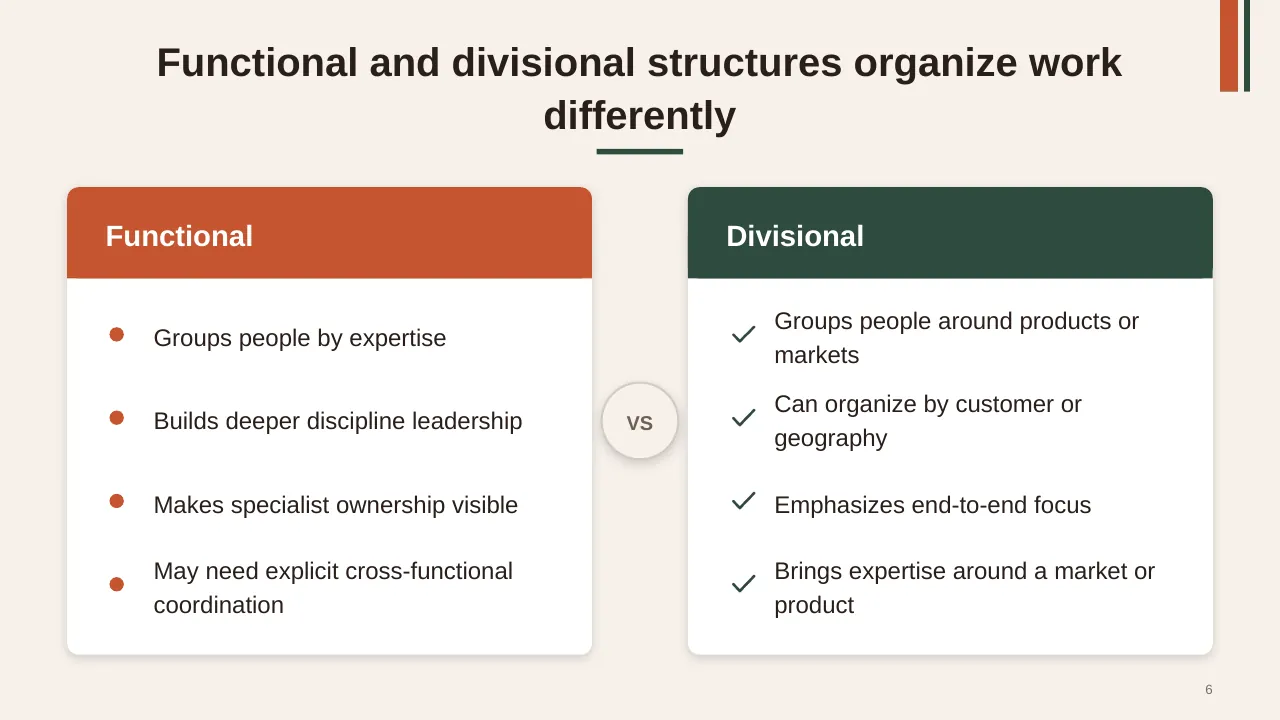
| 6 | Functional and divisional structures organize work differently |
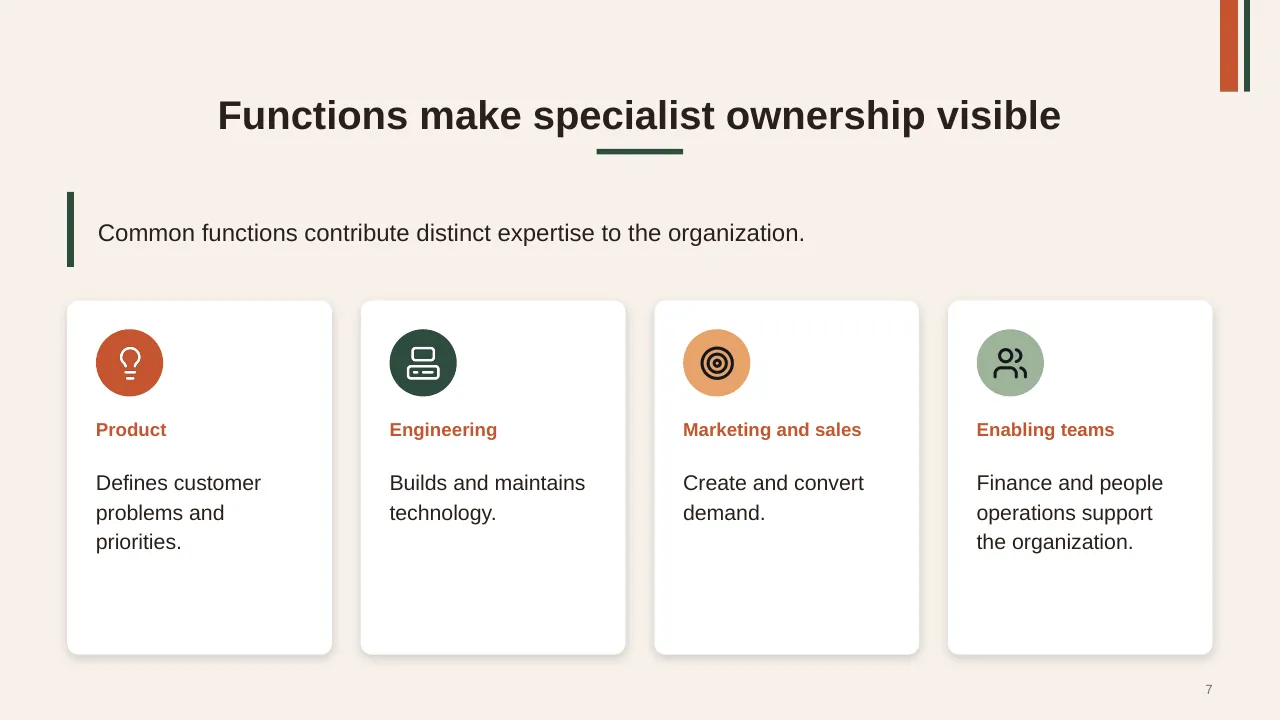
| 7 | Common functions contribute distinct expertise to the organization. |
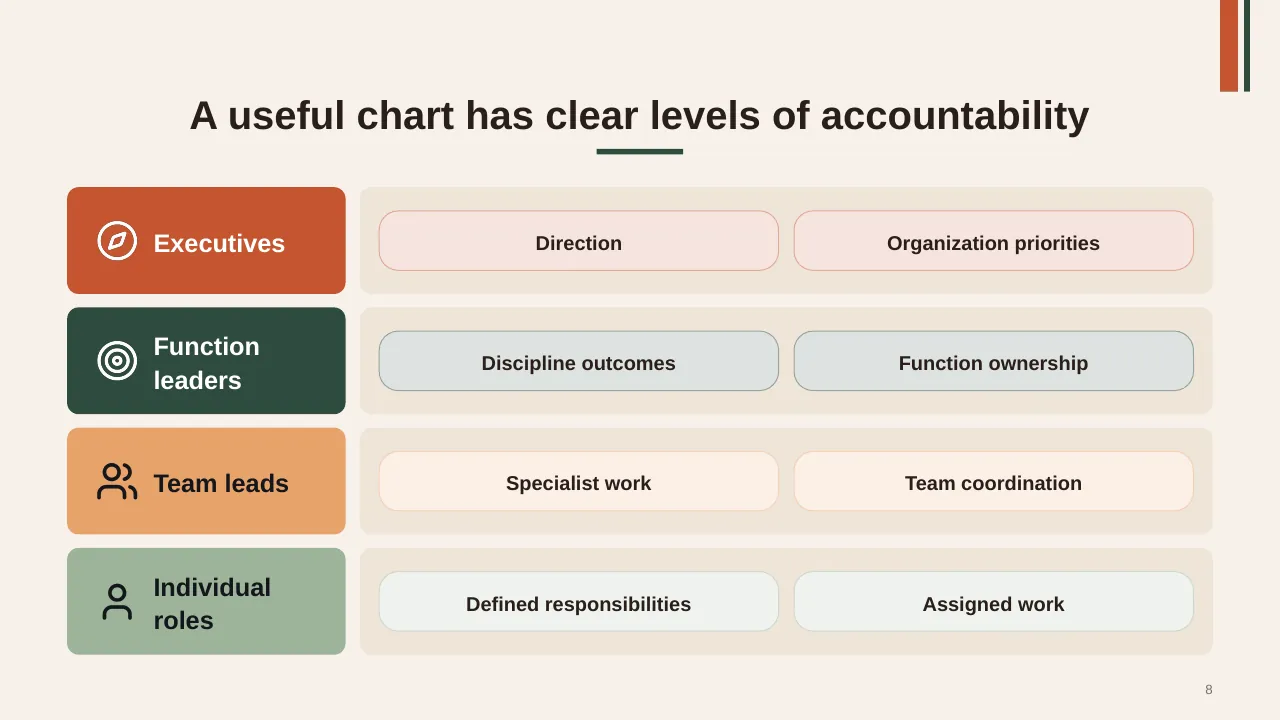
| 8 | A useful chart has clear levels of accountability |
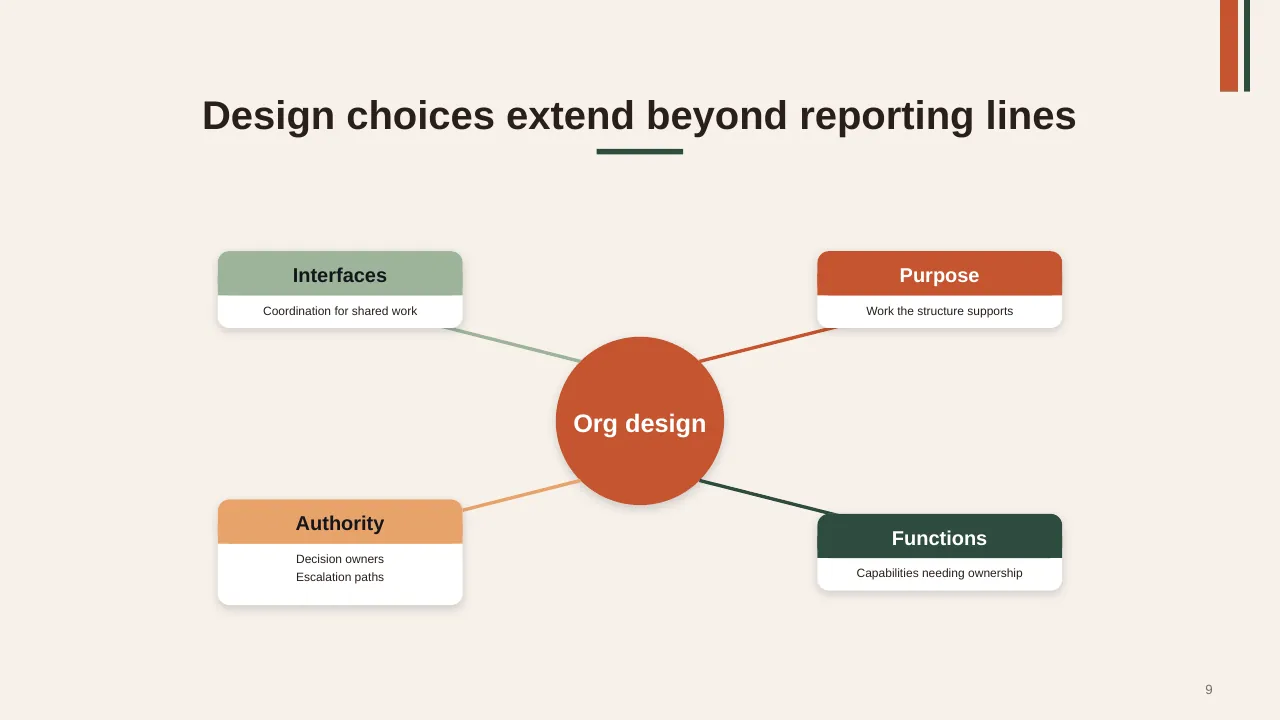
| 9 | Design choices extend beyond reporting lines |
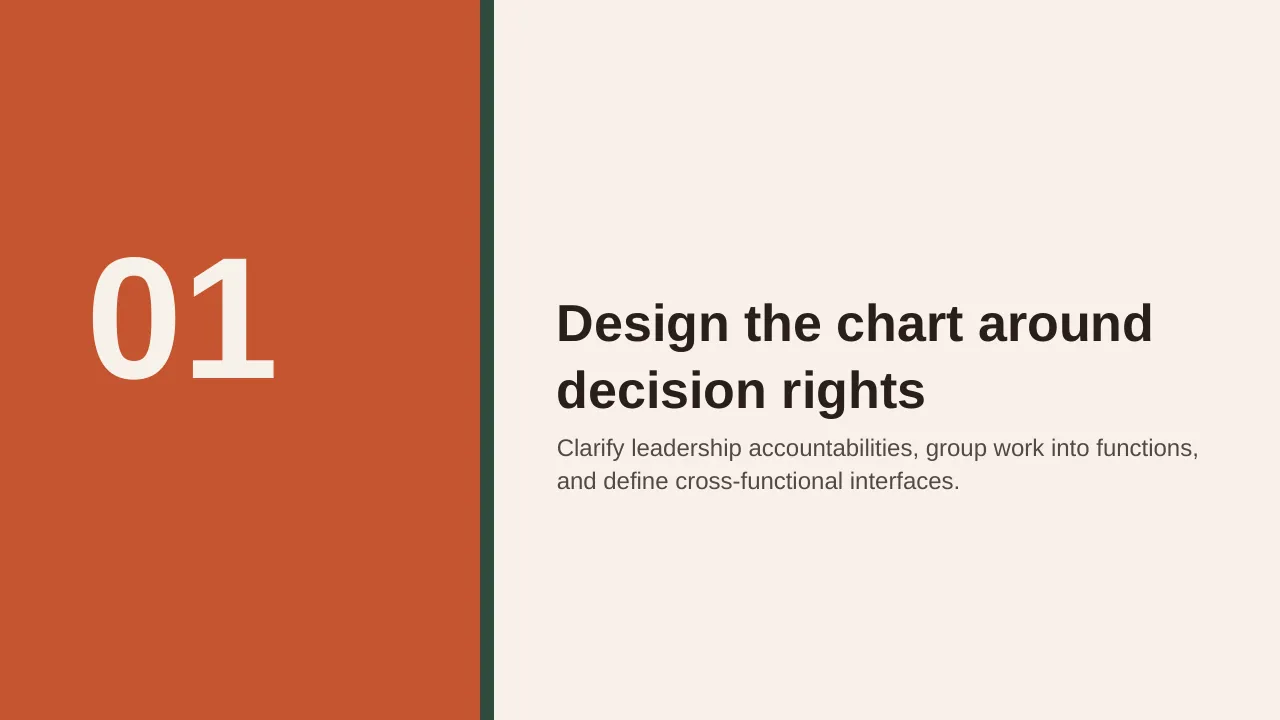
| 10 | Clarify leadership accountabilities, group work into functions, and define cross-functional interfaces. |
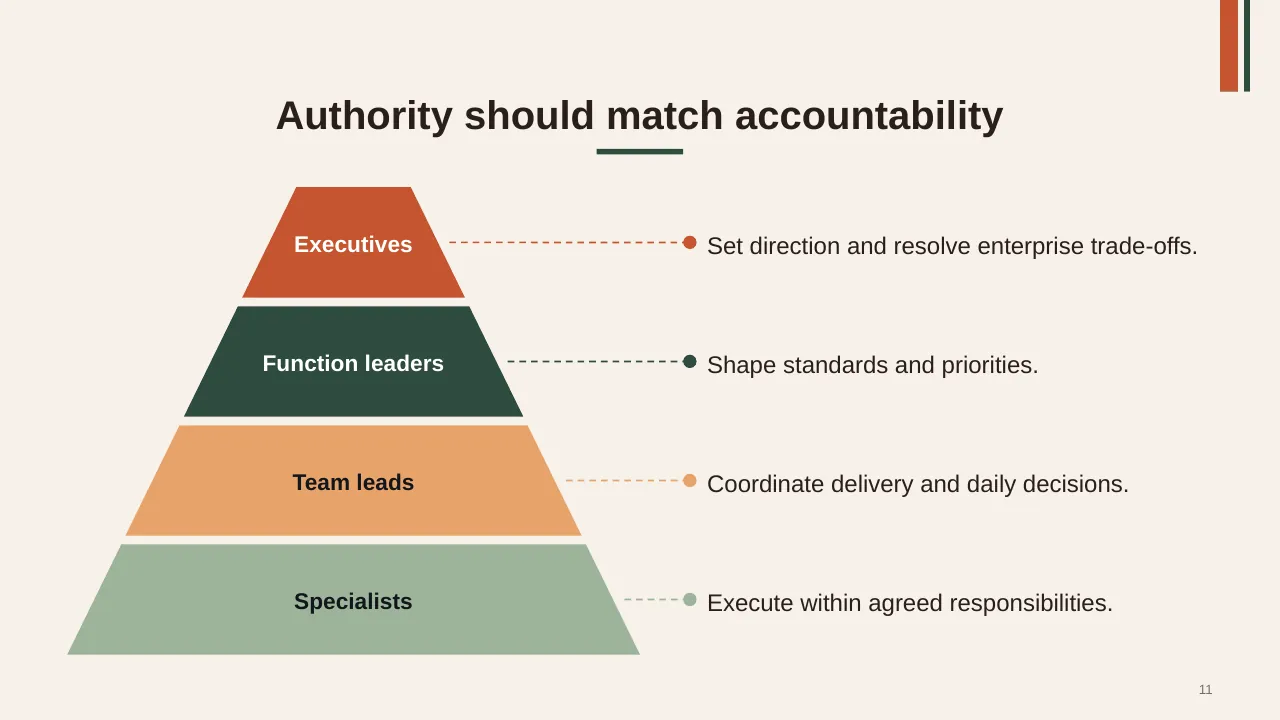
| 11 | Set direction and resolve enterprise trade-offs. |
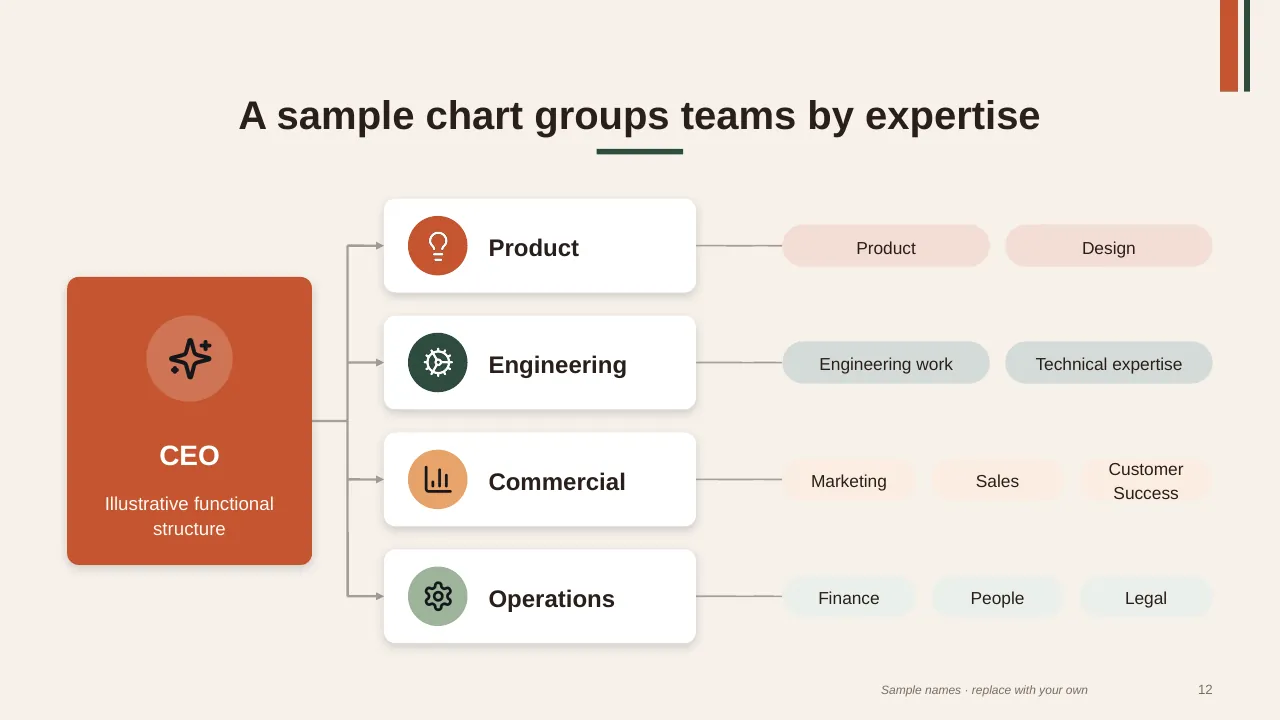
| 12 | A sample chart groups teams by expertise |
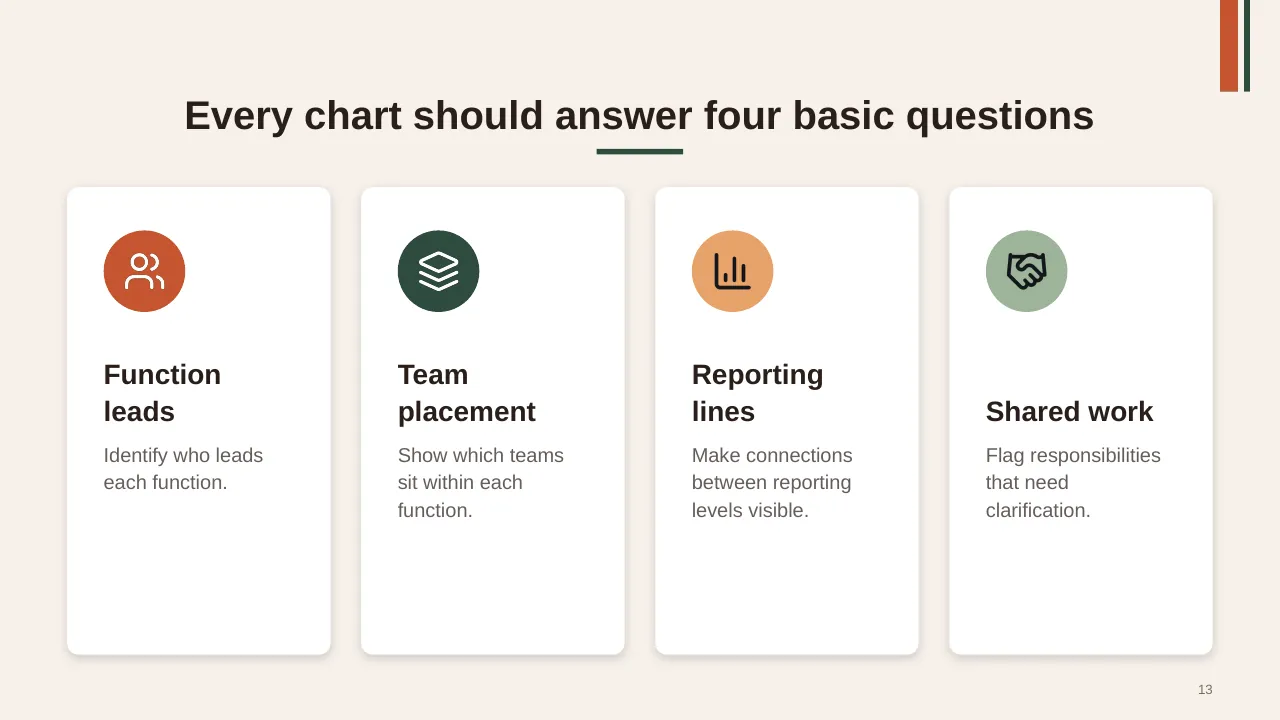
| 13 | Every chart should answer four basic questions |
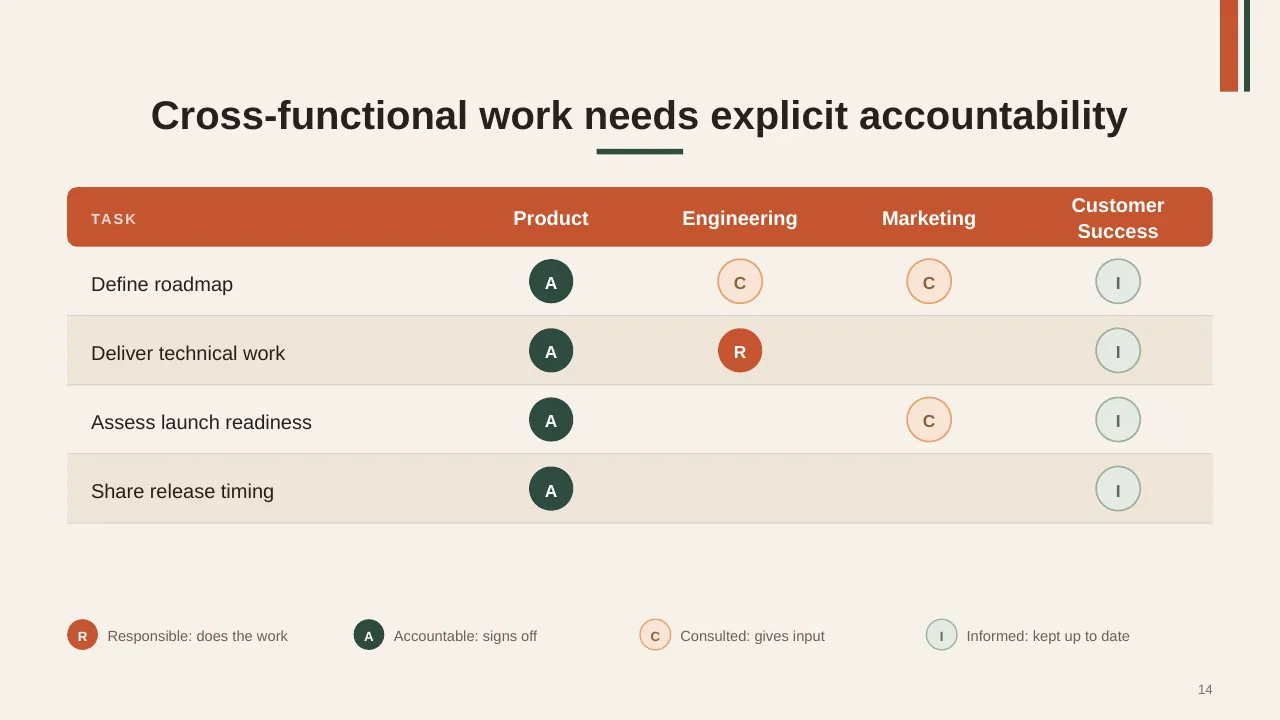
| 14 | Cross-functional work needs explicit accountability |
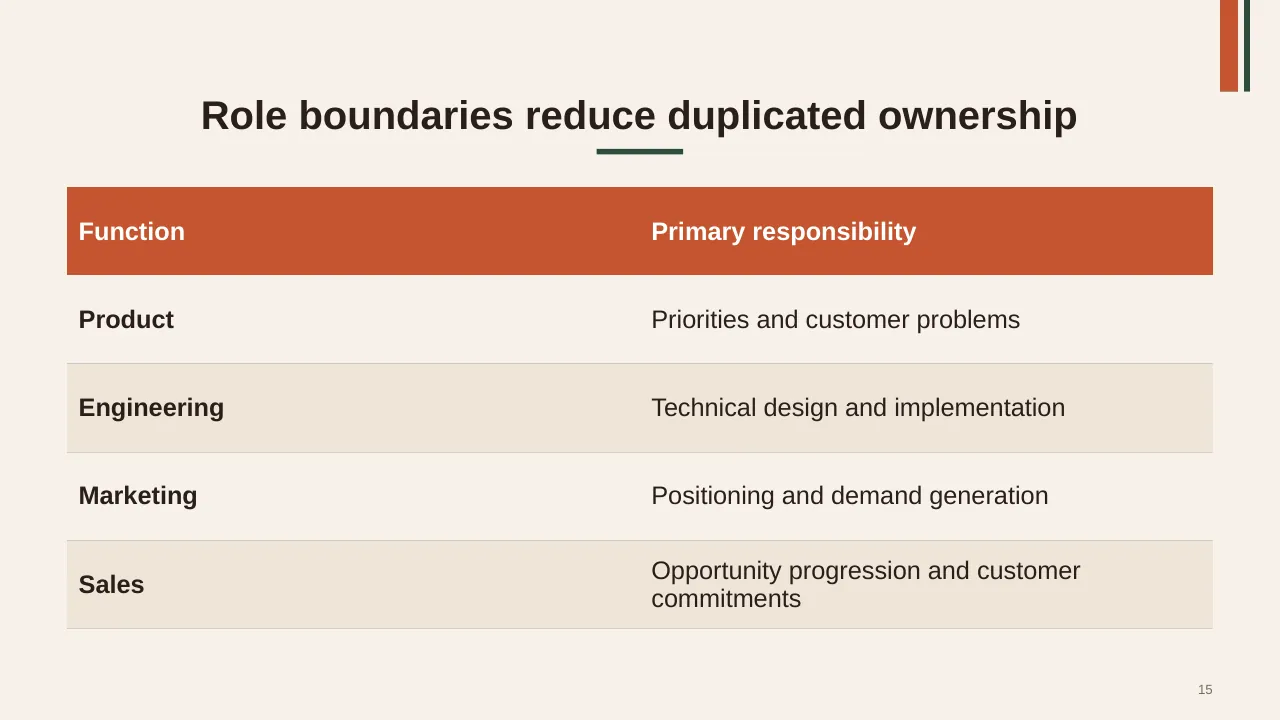
| 15 | Role boundaries reduce duplicated ownership |
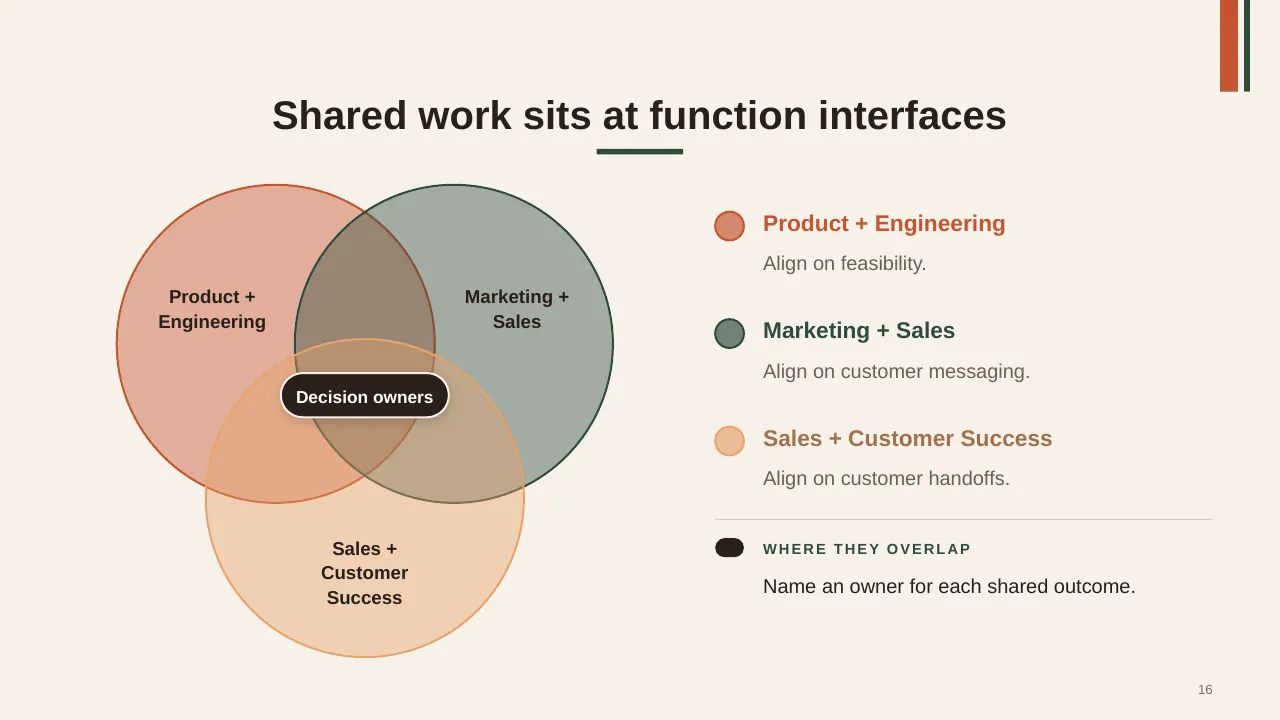
| 16 | Shared work sits at function interfaces |
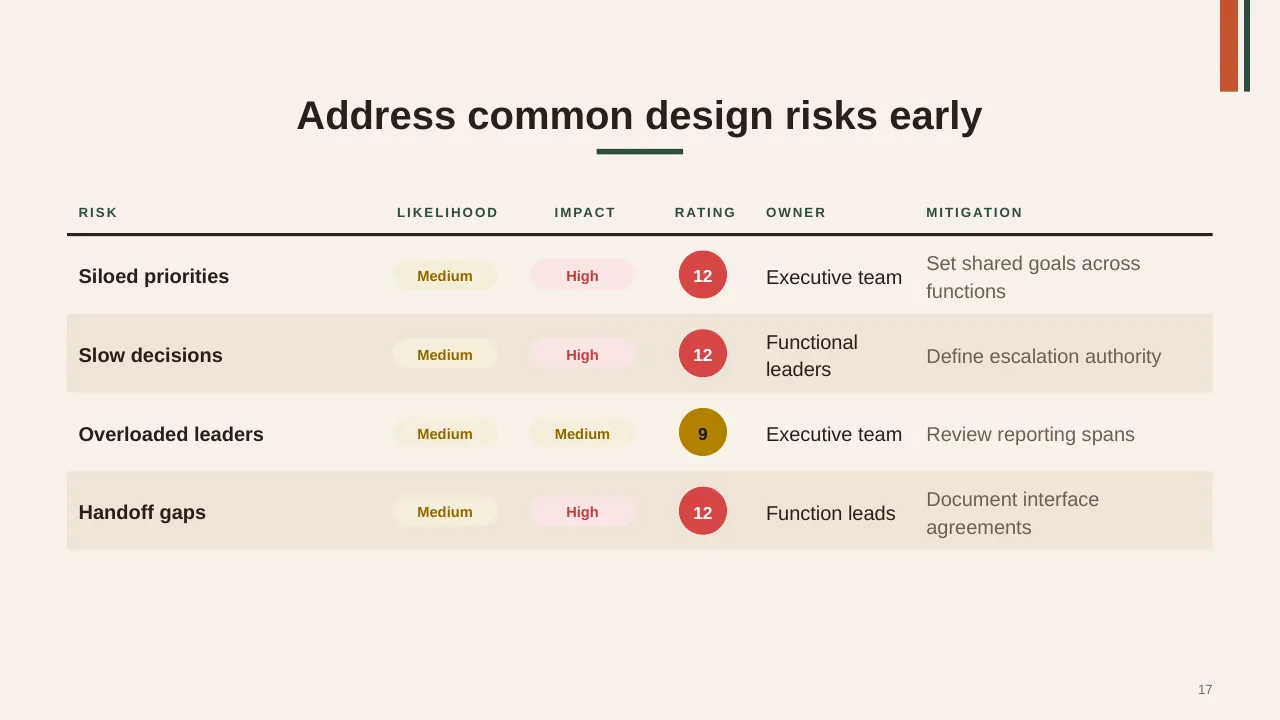
| 17 | Address common design risks early |
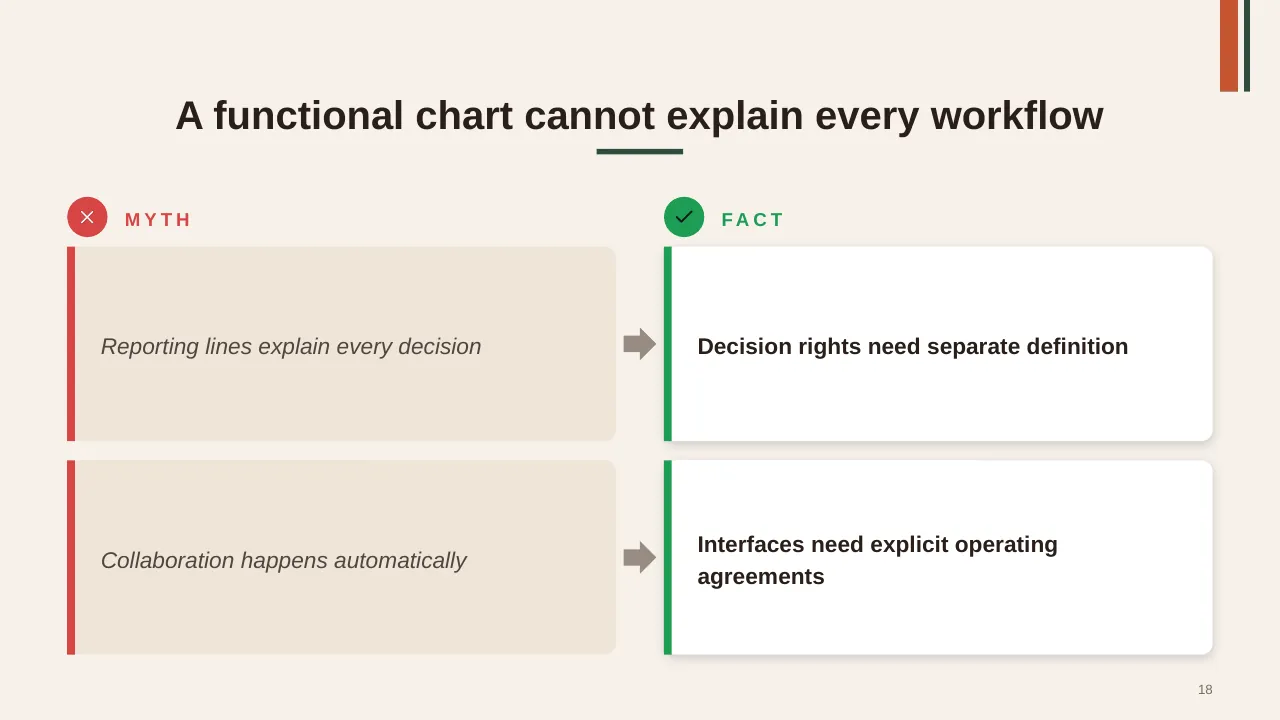
| 18 | A functional chart cannot explain every workflow |
| 19 | Validate the work, assign accountability, then communicate and review the structure. |
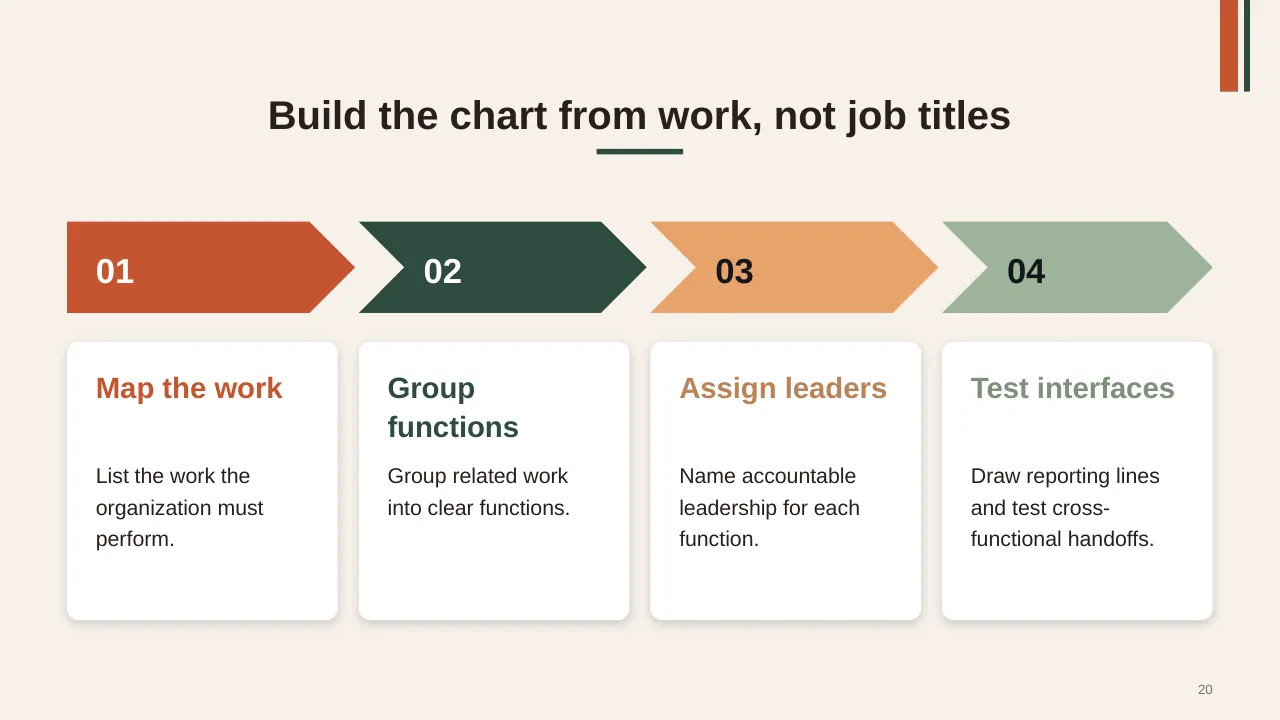
| 20 | Build the chart from work, not job titles |
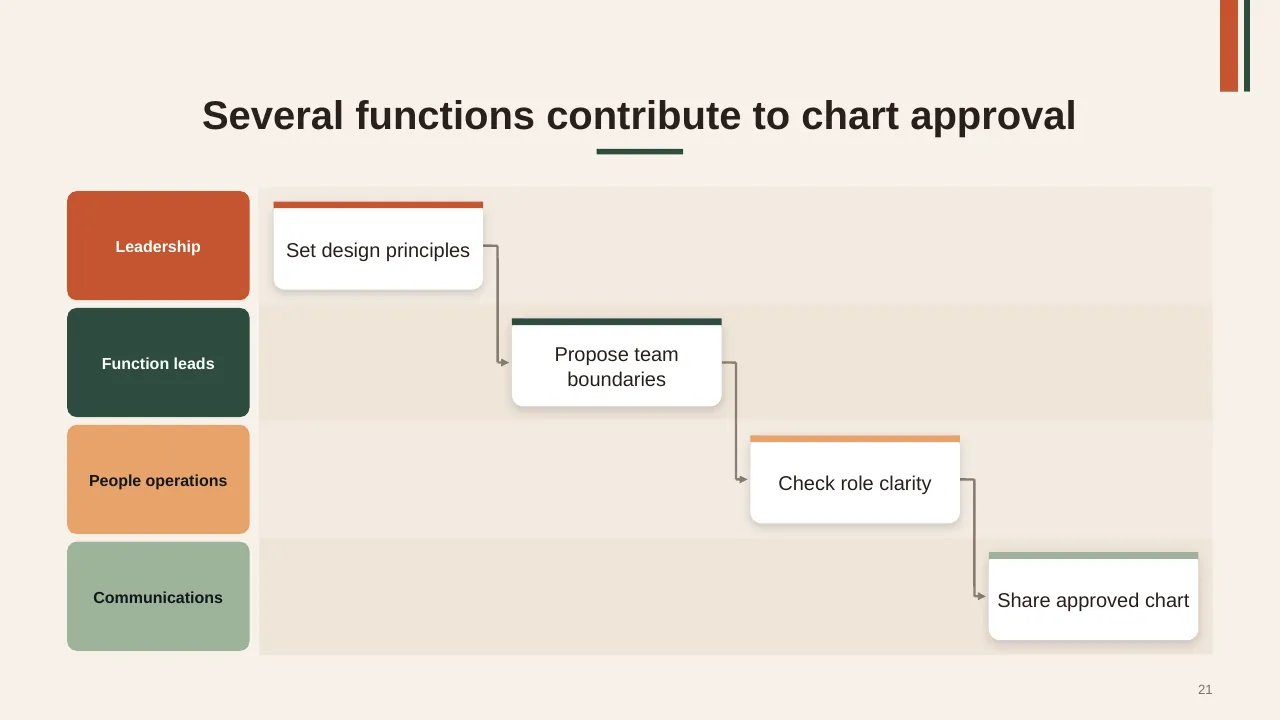
| 21 | Several functions contribute to chart approval |
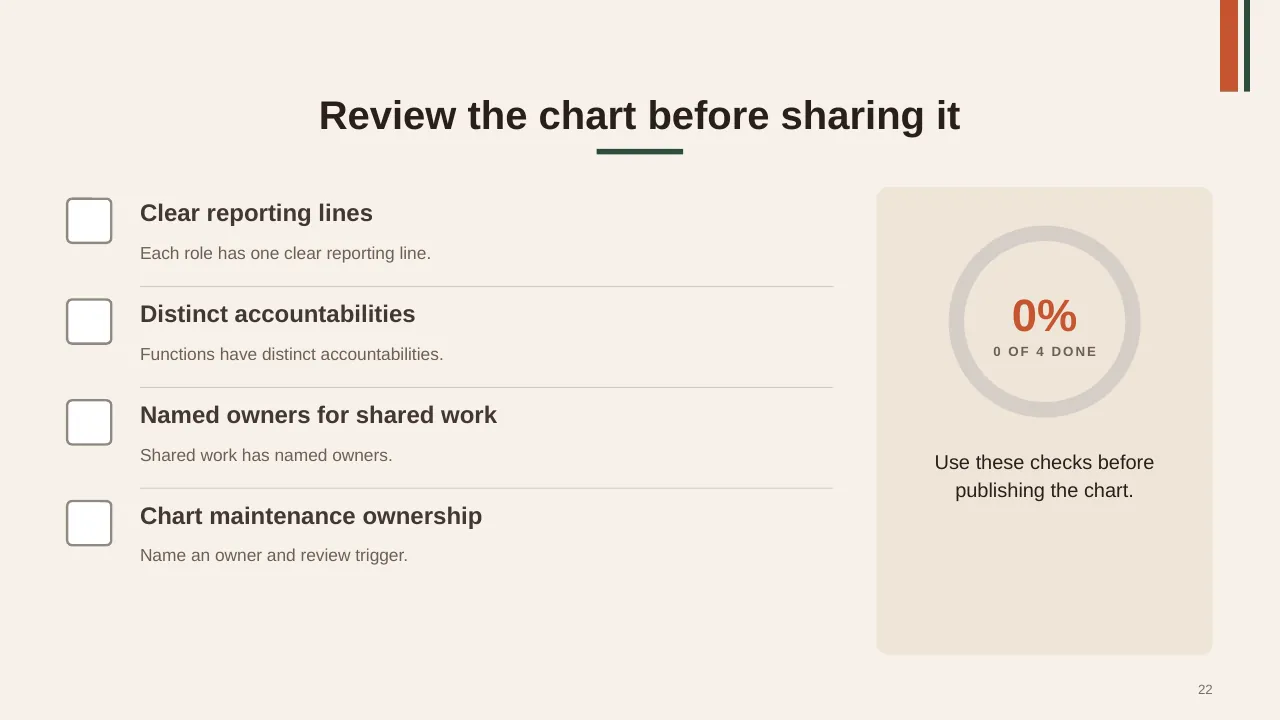
| 22 | Each role has one clear reporting line. |
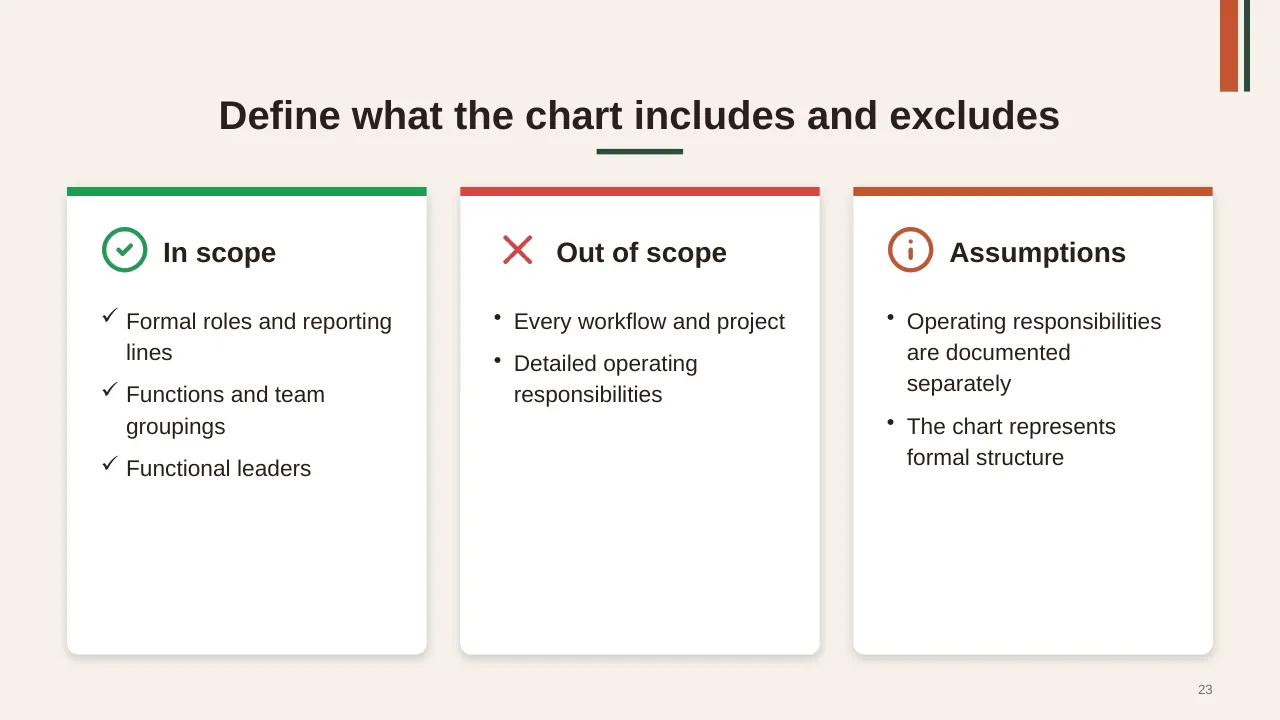
| 23 | Formal roles and reporting lines Functions and team groupings Functional leaders |
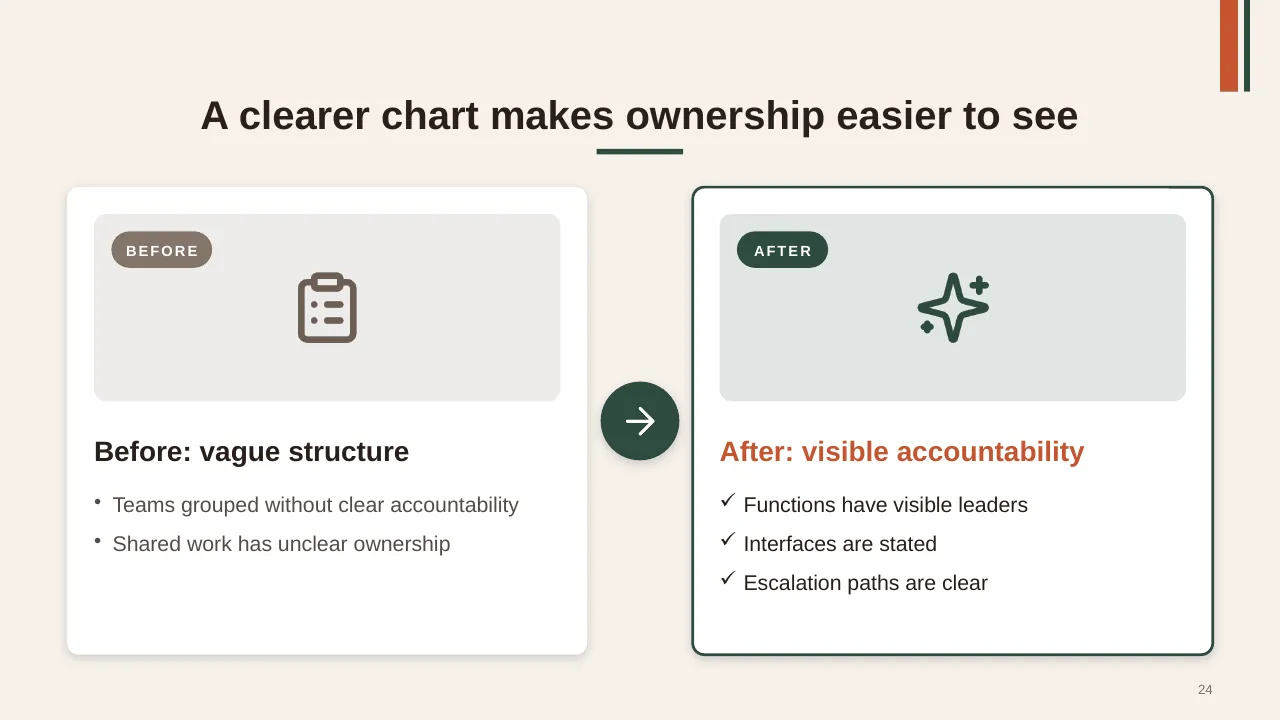
| 24 | A clearer chart makes ownership easier to see |
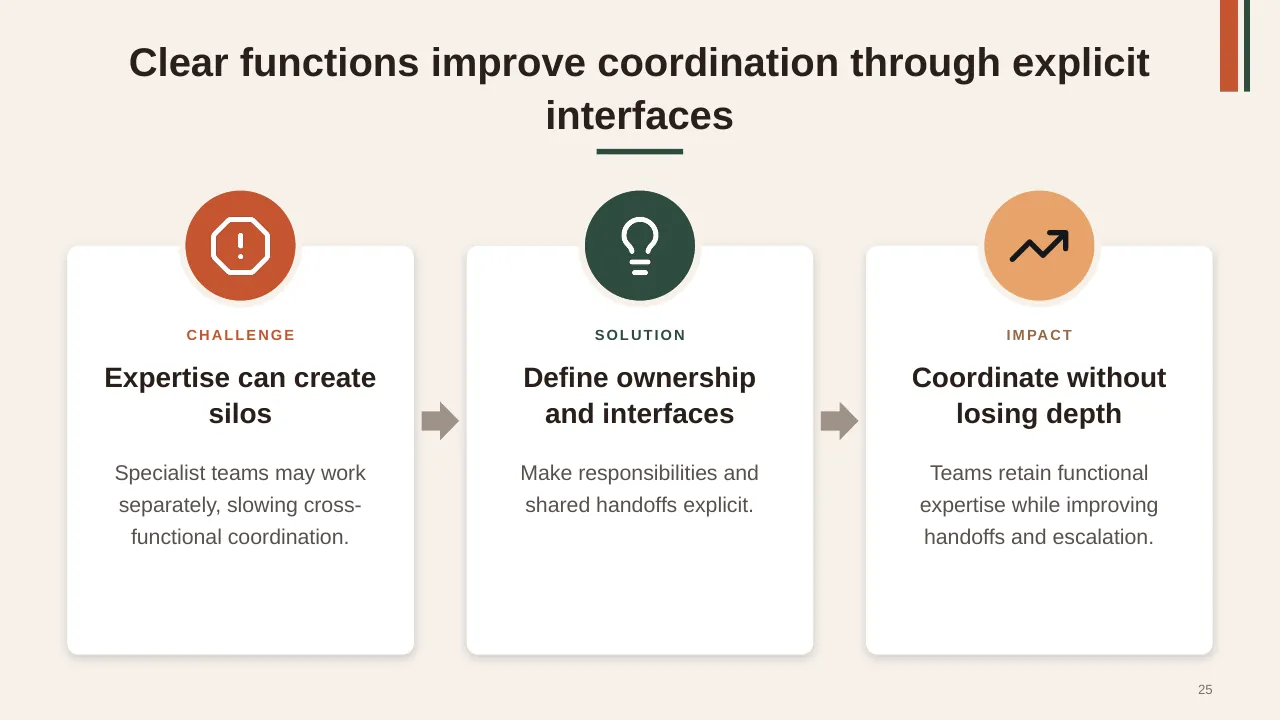
| 25 | Clear functions improve coordination through explicit interfaces |
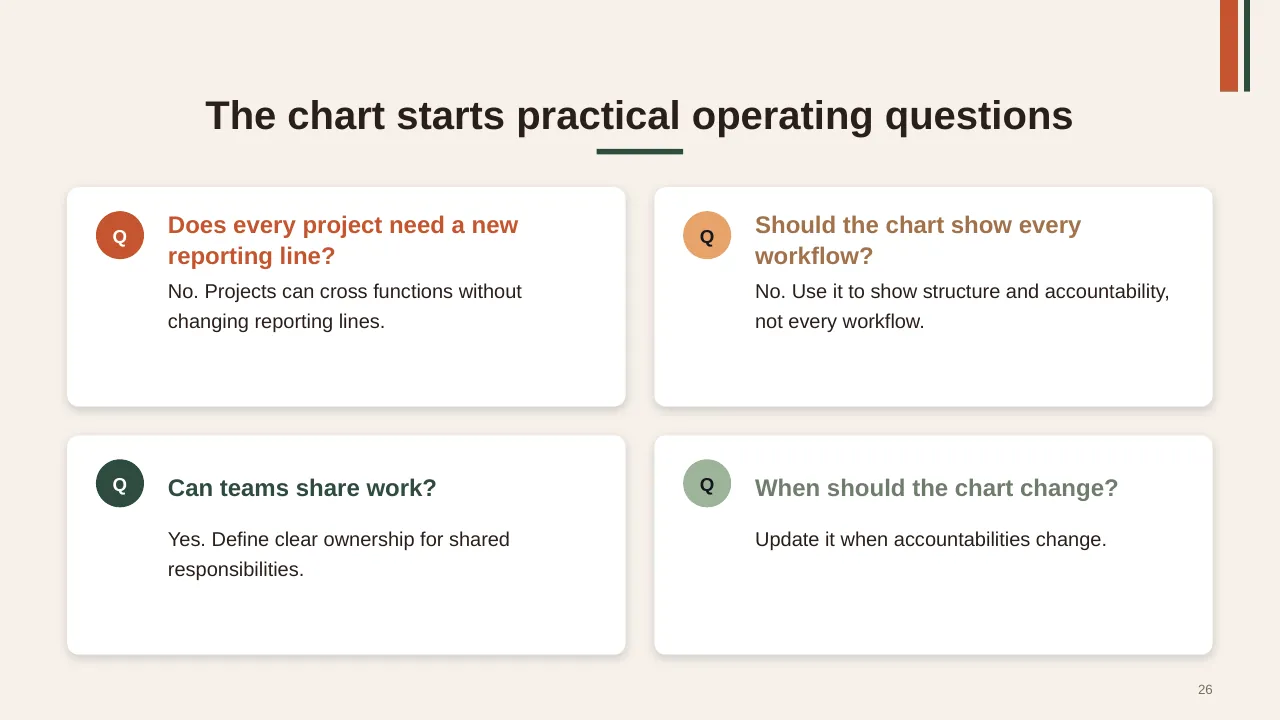
| 26 | The chart starts practical operating questions |
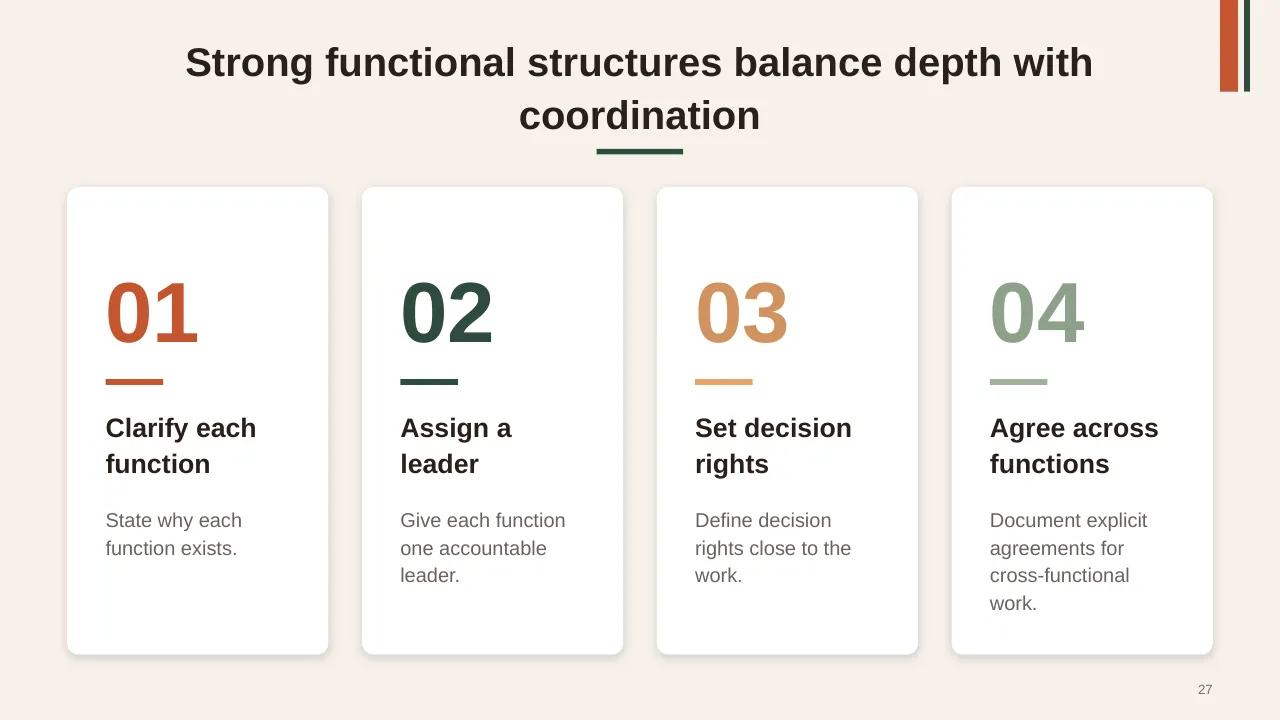
| 27 | Strong functional structures balance depth with coordination |
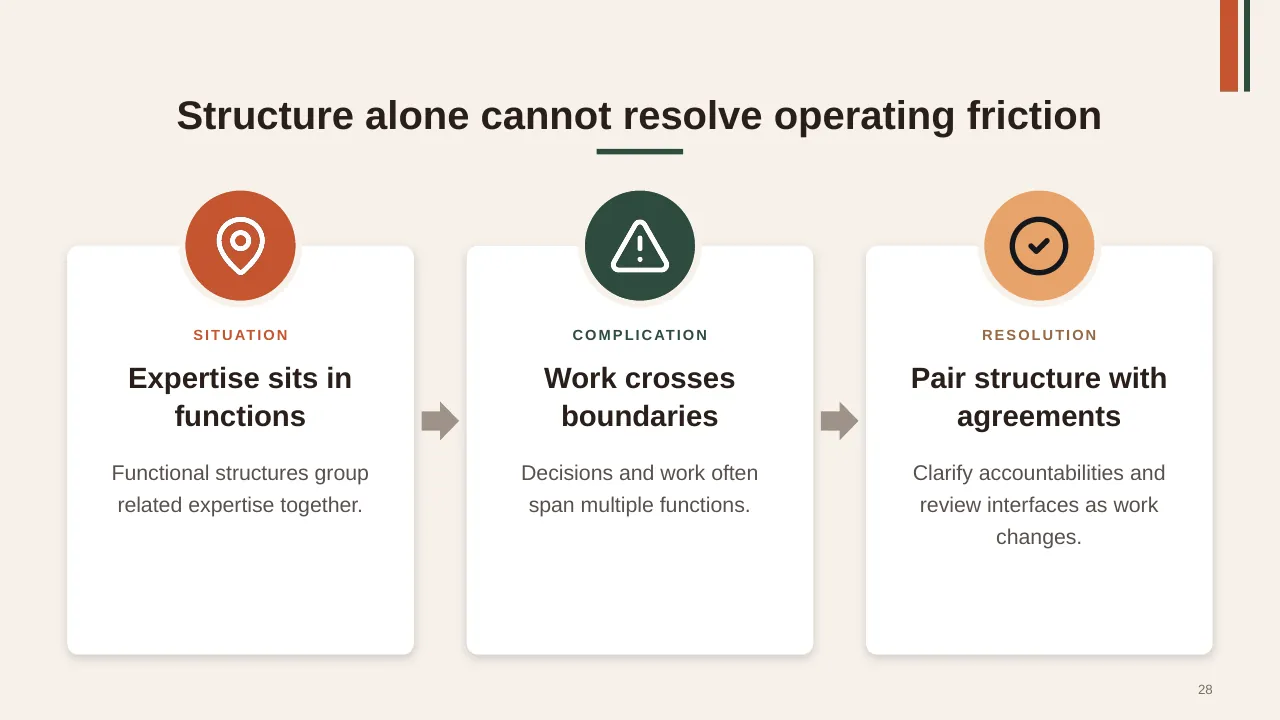
| 28 | Structure alone cannot resolve operating friction |
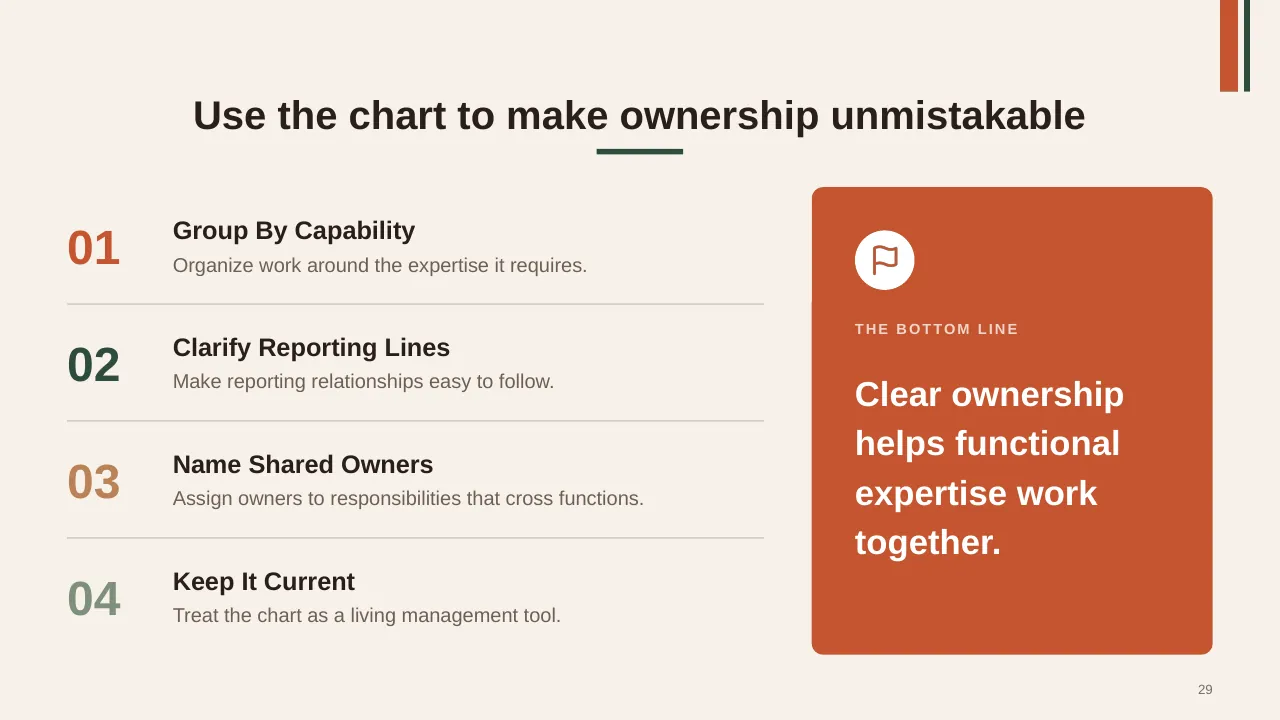
| 29 | Use the chart to make ownership unmistakable |
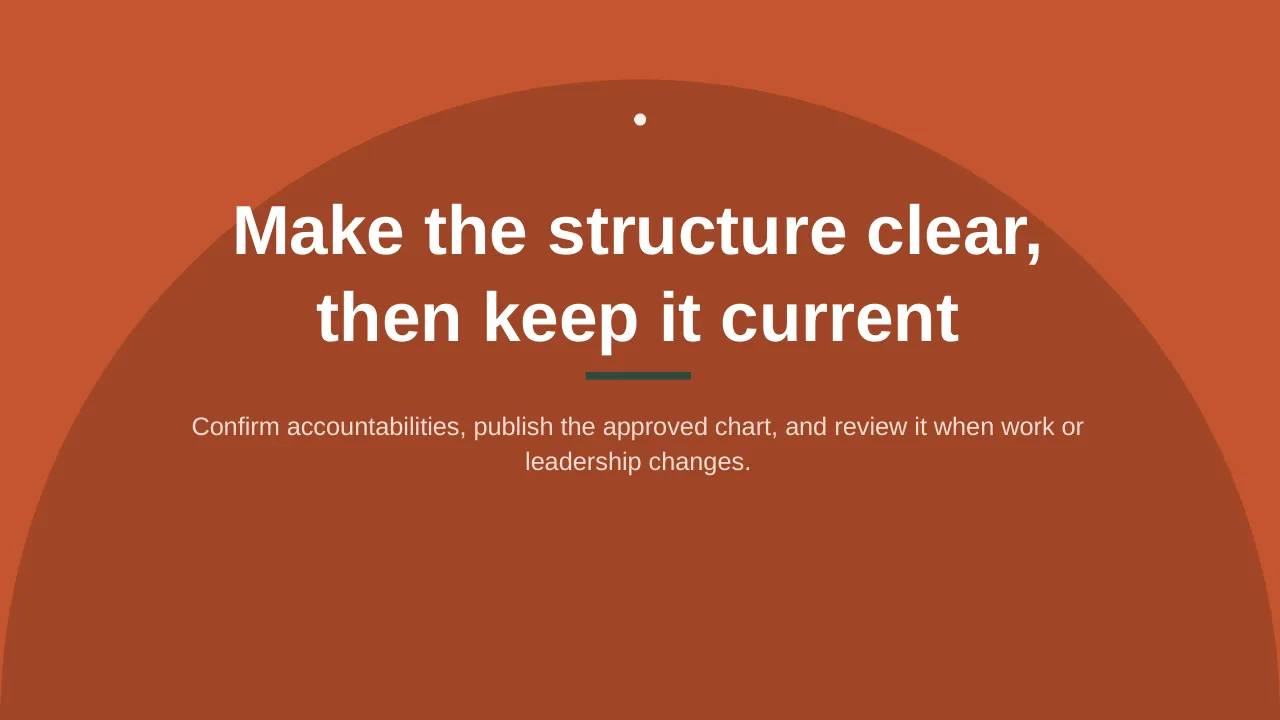
| 30 | Confirm accountabilities, publish the approved chart, and review it when work or leadership changes. |
Tips for a leadership or team presentation
- Keep org charts to two or three levels per slide.
- Add photos and one-line role descriptions.
- Show decision rights, not just boxes.
- Explain how leaders will be supported; DDI found 71% report rising stress.
Mistakes to avoid
- Charts too dense to read
- Titles with no responsibilities
- Out-of-date names
Checklist before you present
- Is the structure readable?
- Are roles described?
- Are decision rights clear?
- Are names and photos current?
- Is support for leaders covered?
Great for
- HR strategy and policy updates
- Onboarding and employee handbooks
- Team introductions and org charts
- Training and leadership programmes
How to customise it
- Download the ZIP file and unzip it to get the .pptx presentation.
- Open it in PowerPoint, or upload it to Google Drive and open it with Google Slides.
- Replace the sample text and numbers with your own; charts update from their data sheets.
- Change the theme colours once to recolour the whole deck, then delete any slides you don't need.
Questions about a leadership or team presentation
How do I edit the org chart?
Click any box to change names and titles, and copy or delete boxes to add or remove roles; connectors stay attached as you move shapes.
What is a leadership competency framework?
A set of behaviours and skills expected of leaders at each level, used for hiring, development and performance reviews.
Related presentations
- People and Teamwork Strategy PPT Template
- HR Management PPT Template
- Organizational Chart PPT Template
- Multiple Jigsaw Learning PPT Template
Browse all HR & People Management presentations or more business PowerPoint templates.
Template details
| Template | Functional Org Chart PPT Template |
|---|---|
| Categories | Business PowerPoint Templates, HR & People Management |
| File format | PowerPoint (.pptx), delivered as a .zip file |
| Number of slides | 30 fully editable slides |
| File size | 2.4 MB |
| Slide size | 16:9 widescreen |
| Preview images | 30 |
| Editable | Yes: text, colours, shapes, icons and charts |
| Works with | PowerPoint 2010 and later, PowerPoint for Mac, Google Slides |
| Licence | Royalty-free, yours to keep using after your plan ends (terms of use apply) |
| Price | Included in every SlideVilla plan |
| Added | 25 Mar 2025 |
Questions about this template
Can I edit the Functional Org Chart PPT Template?
Yes. Every part of the Functional Org Chart PPT Template is made with native PowerPoint shapes and text boxes, so you can change the wording, colours, fonts and sizes, move or delete elements, and swap icons without losing quality.
Does the Functional Org Chart PPT Template work in Google Slides?
Yes. Download the .zip file, unzip it to get the .pptx, upload it to Google Drive and open it with Google Slides. The layout, shapes and text stay editable there too.
Is the Functional Org Chart PPT Template free?
It is a premium template, included in every SlideVilla plan together with the rest of the library. See plans and pricing.
What size and format is it?
It is a PPTX file in 16:9 widescreen format with 30 slides, 2.4 MB (downloaded as a .zip; unzip it to get the presentation), with 30 preview images shown above.
How to use this template
- Step 1DownloadClick Download, then unzip the .zip file to get the .pptx presentation.
- Step 2OpenOpen it in PowerPoint, or upload it to Google Slides from your Drive.
- Step 3Make it yoursChange text, colours, icons and charts. Every element is fully editable.
Tags
Related PowerPoint templates
More designs like this one, ready to edit.