About this PowerPoint template
The Financial Performance KPI PowerPoint Template is a complete 20-slide presentation: a practical framework for selecting, interpreting, and acting on financial measures. Every slide is fully editable in PowerPoint and Google Slides, so you can change the text, colours, charts and icons to fit your brand in minutes.
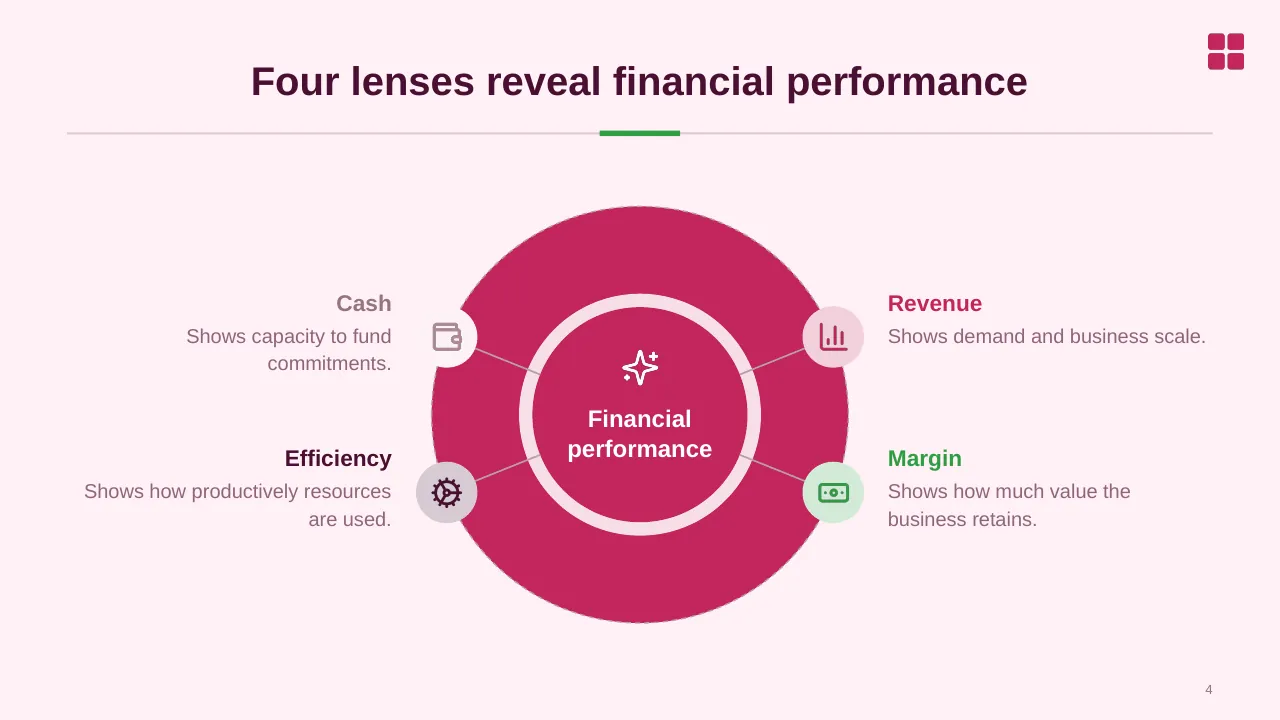
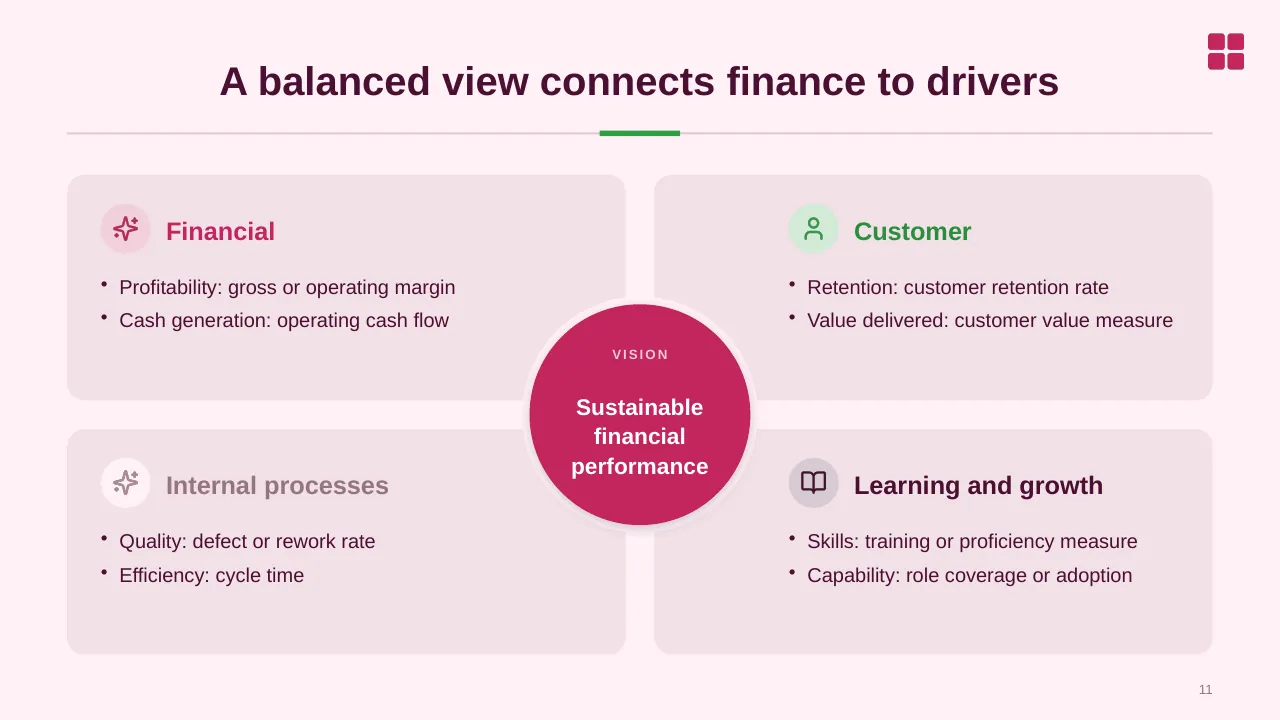
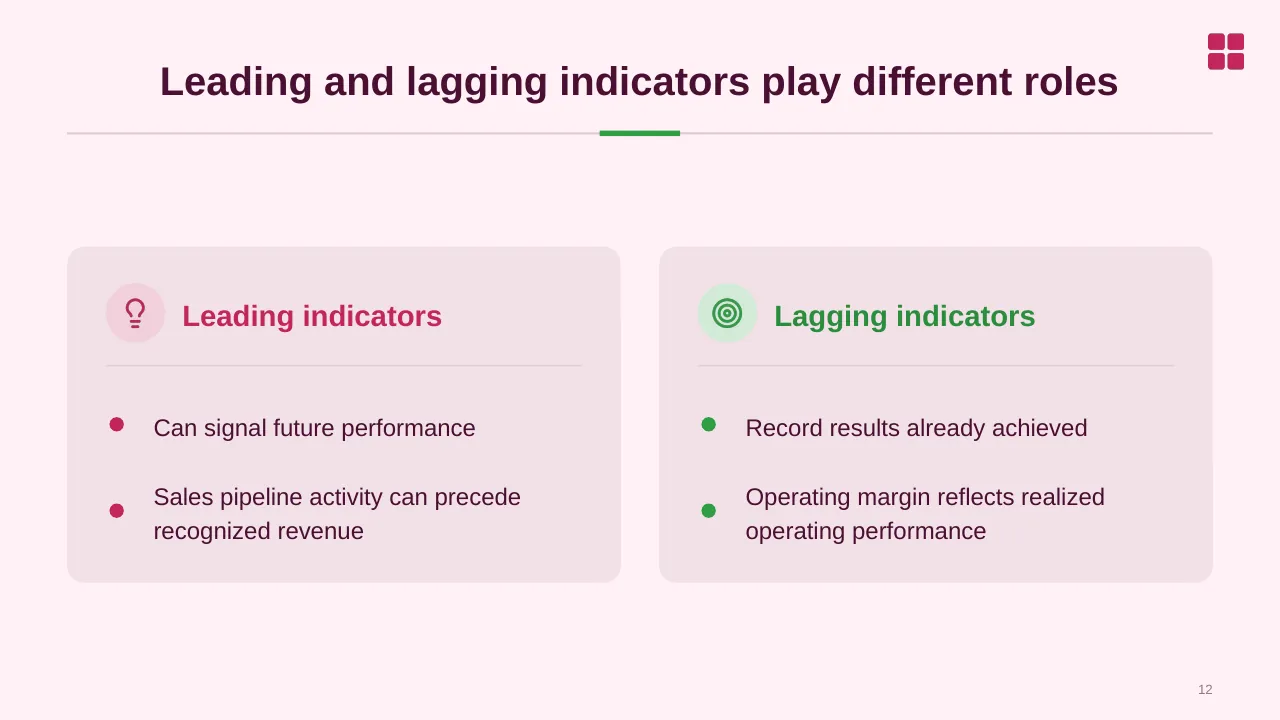
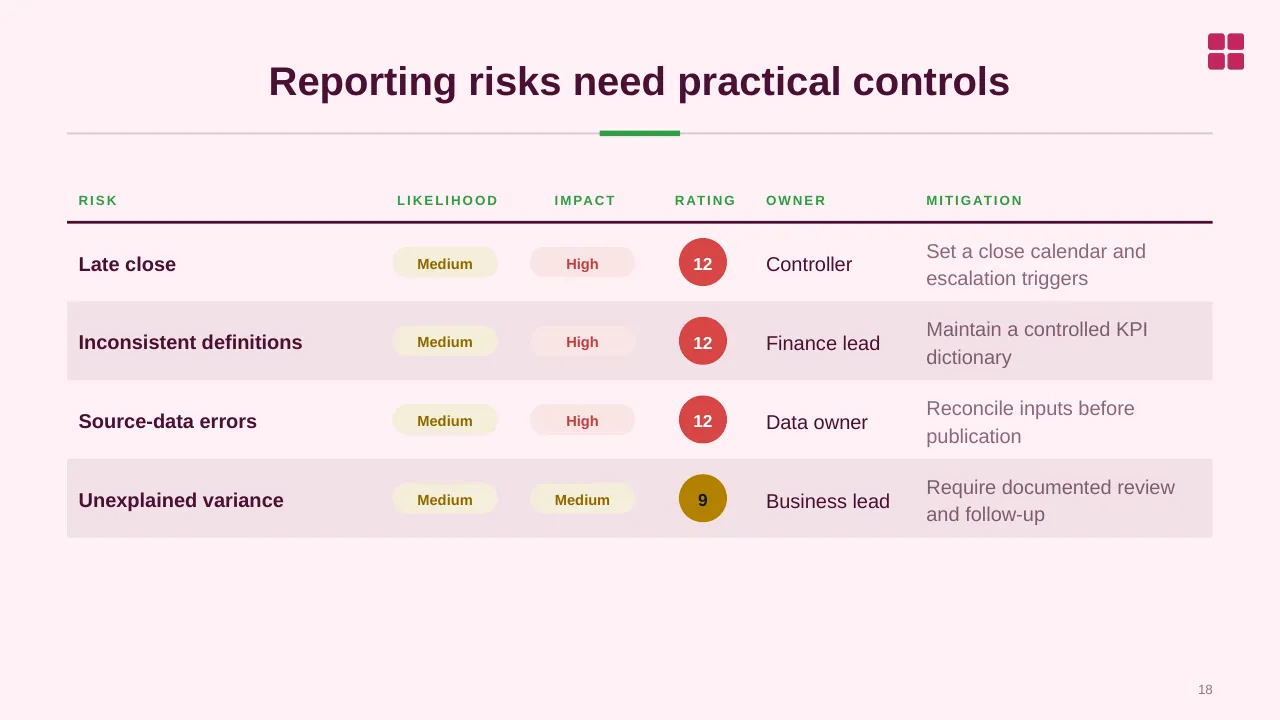
Inside, the slides walk through topics such as “Four lenses reveal financial performance”, “Leading and lagging indicators play different roles” and “Reporting risks need practical controls”, with ready-made layouts for each step. It is part of our KPI Dashboards presentations.
On this page
What's included
- 20 professionally designed 16:9 widescreen slides
- 100% editable text, shapes, icons, tables and charts (no flat images)
- Works in Microsoft PowerPoint (Windows and Mac) and Google Slides
- Clean, consistent layout that follows your theme colours and fonts
- Delivered as a single ZIP file containing the .pptx presentation
What to include in a financial presentation
A simple structure that works for most audiences, mapped to the slides in this deck:
| Part | What goes there | Slide in this deck |
|---|---|---|
| Summary | Key numbers and the story behind them | Use any content slide |
| Budget vs actual | Variances by line and the reasons | Slides 5, 7, 8 |
| Forecast | Outlook and assumptions | Use any content slide |
| Investments | Capital needs, returns and payback | Use any content slide |
| Risks and actions | Financial risks and decisions needed | Slides 2, 10, 15 |
Key numbers: Finance and budgeting
Research figures you can quote on your slides. Each one names the study it comes from, so your audience can check it.
| Finding | Figure | Source |
|---|---|---|
| Finance leaders who rank forecast accuracy among their top three FP&A goals | 72% | Vena, FP&A Impact Report (2026) |
| Finance leaders who use spreadsheets as a main budgeting tool | 61% | Vena, FP&A Impact Report (2026) |
| FP&A teams that rate their forecasts good or great | 42% (65% with AI/ML) | FP&A Trends Survey (2024) |
| CFOs ranking better forecast accuracy in their top five priorities | 51% | Gartner CFO survey (2025) |
Sources: Vena, FP&A trends and predictions · FP&A Trends Survey 2024 (PDF) · CPA Practice Advisor on the Gartner CFO survey. Figures are from the editions named; check for a newer edition before you present.
Slide-by-slide outline
| Slide | What it covers |
|---|---|
| 1 | Title slide: Financial Performance KPI |
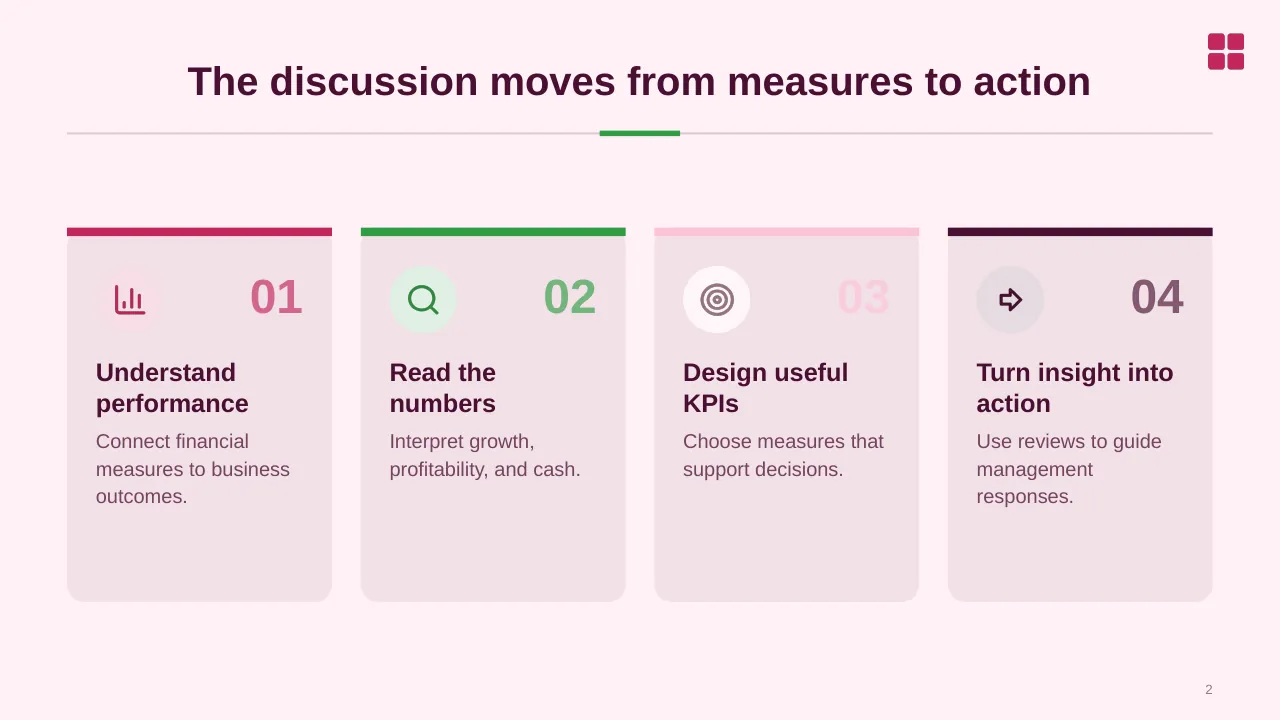
| 2 | The discussion moves from measures to action |
| 3 | Growth shows scale, profitability shows value creation, and cash signals resilience. |
| 4 | Four lenses reveal financial performance |
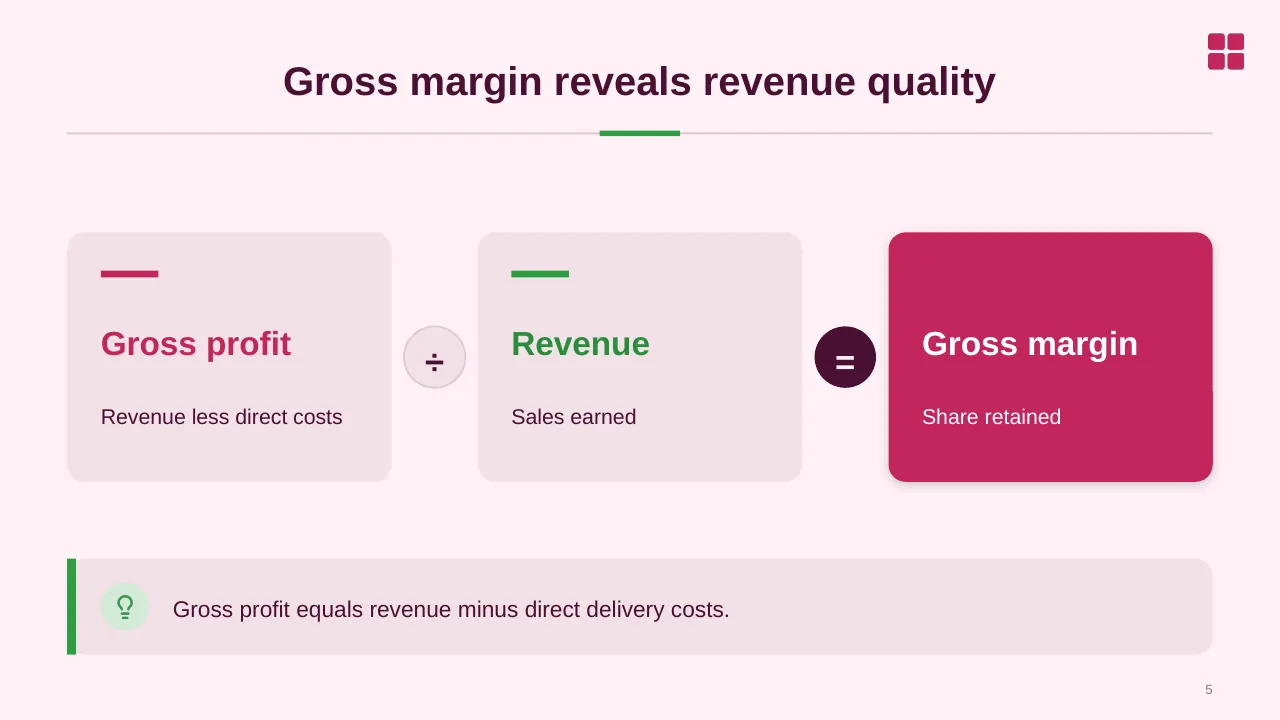
| 5 | Gross margin reveals revenue quality |
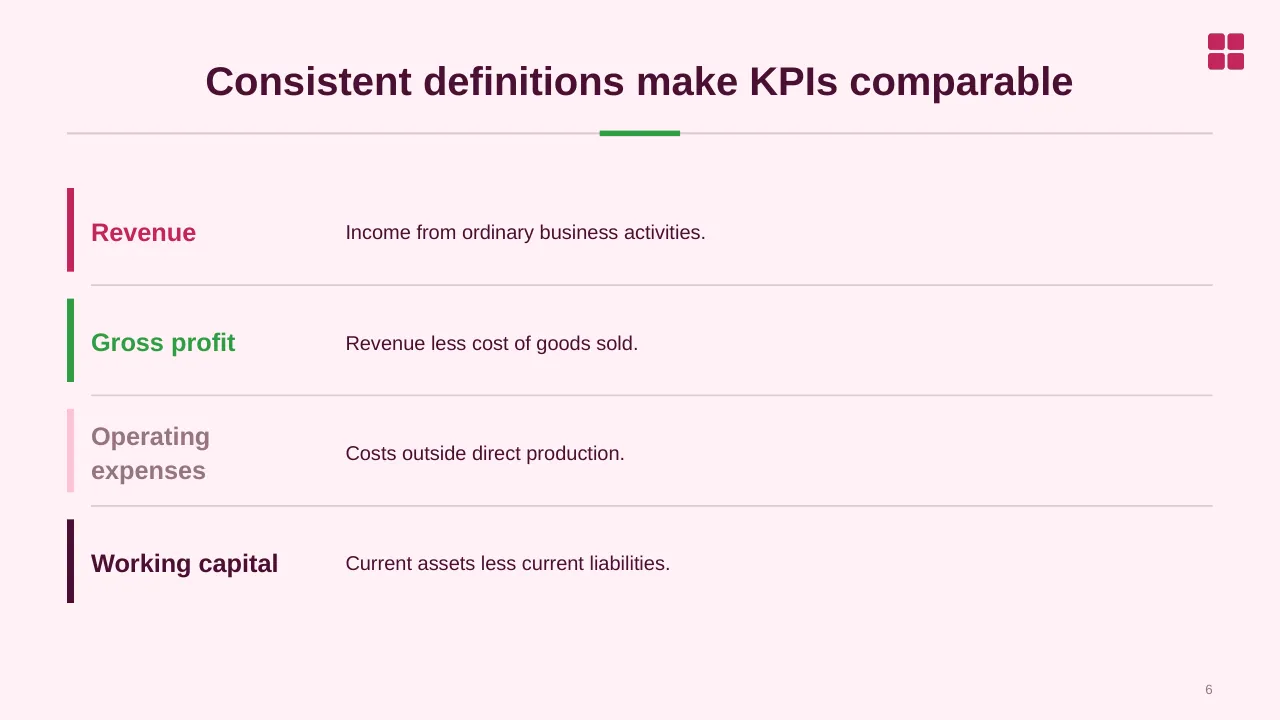
| 6 | Consistent definitions make KPIs comparable |
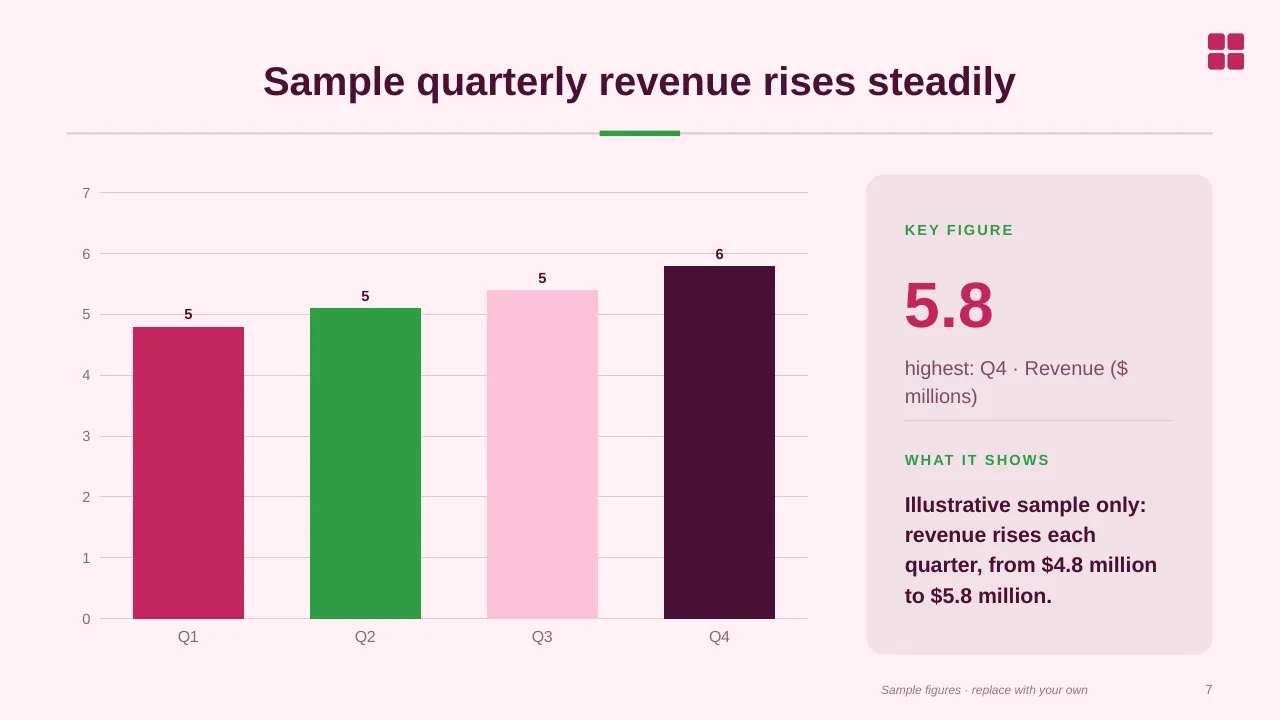
| 7 | Sample quarterly revenue rises steadily |
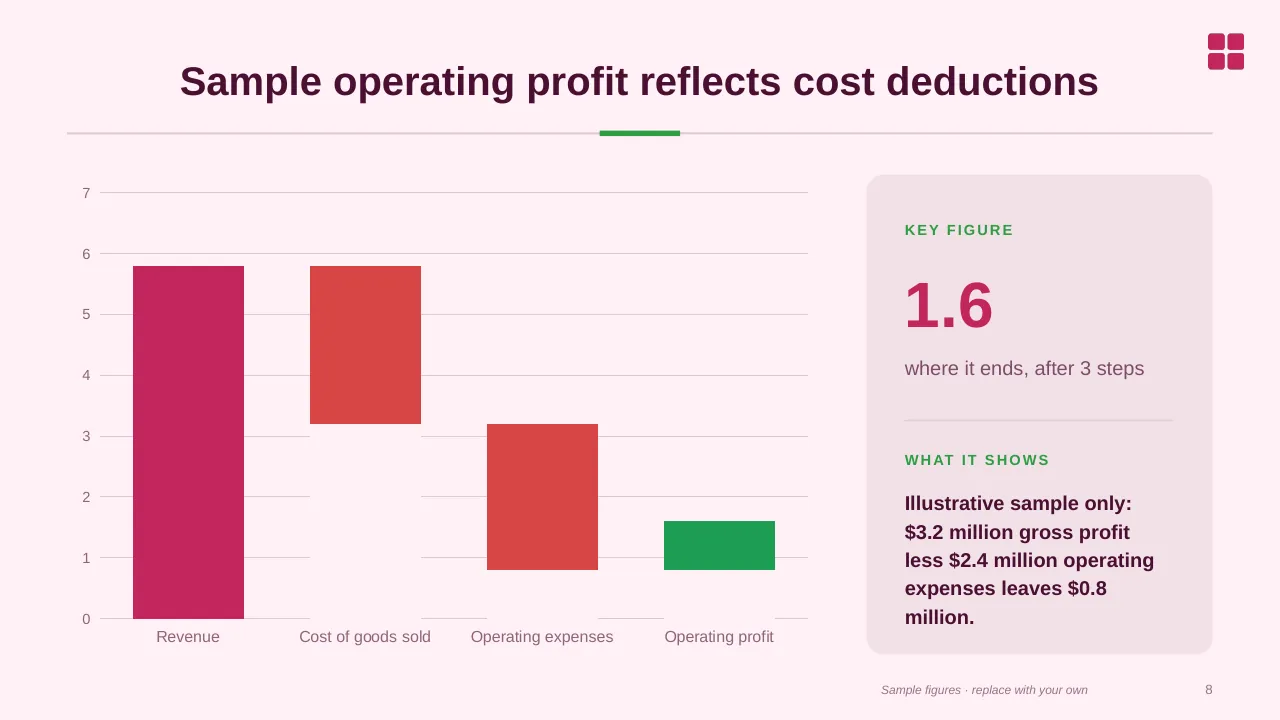
| 8 | Sample operating profit reflects cost deductions |
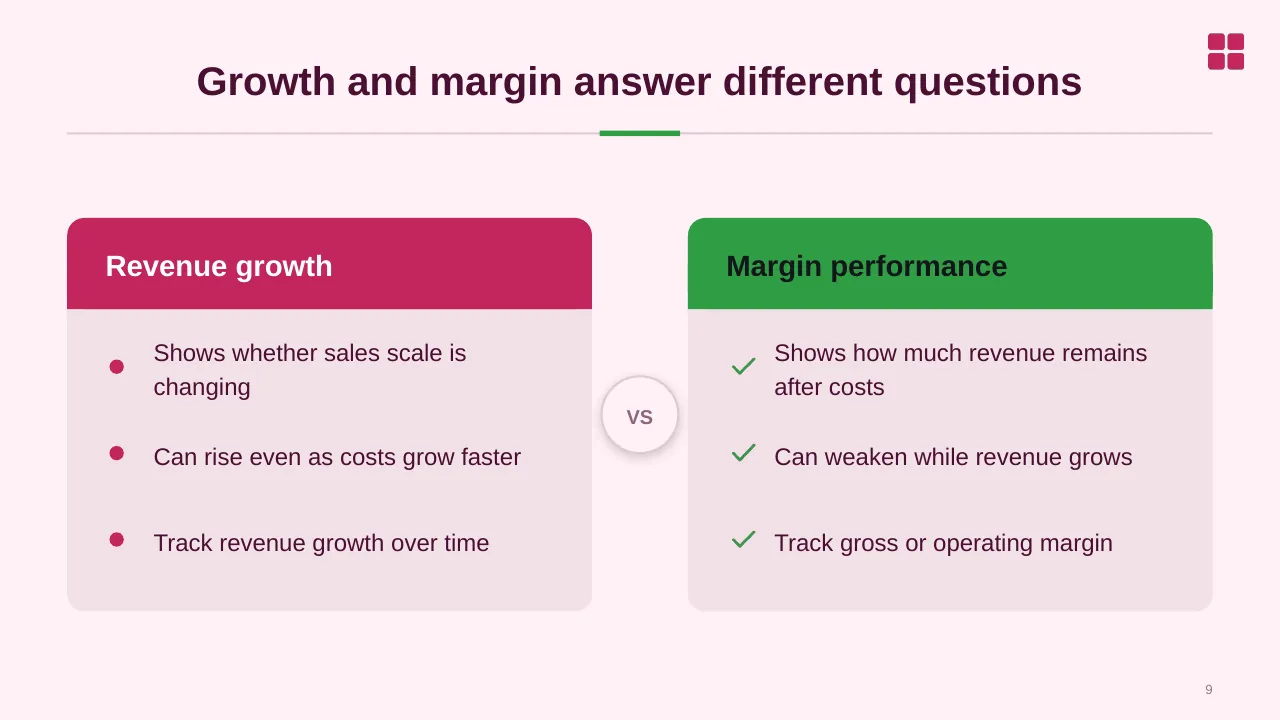
| 9 | Growth and margin answer different questions |
| 10 | Select decision-linked measures, balance outcomes with early signals, and review ownership consistently. |
| 11 | Profitability: gross or operating margin Cash generation: operating cash flow |
| 12 | Leading and lagging indicators play different roles |
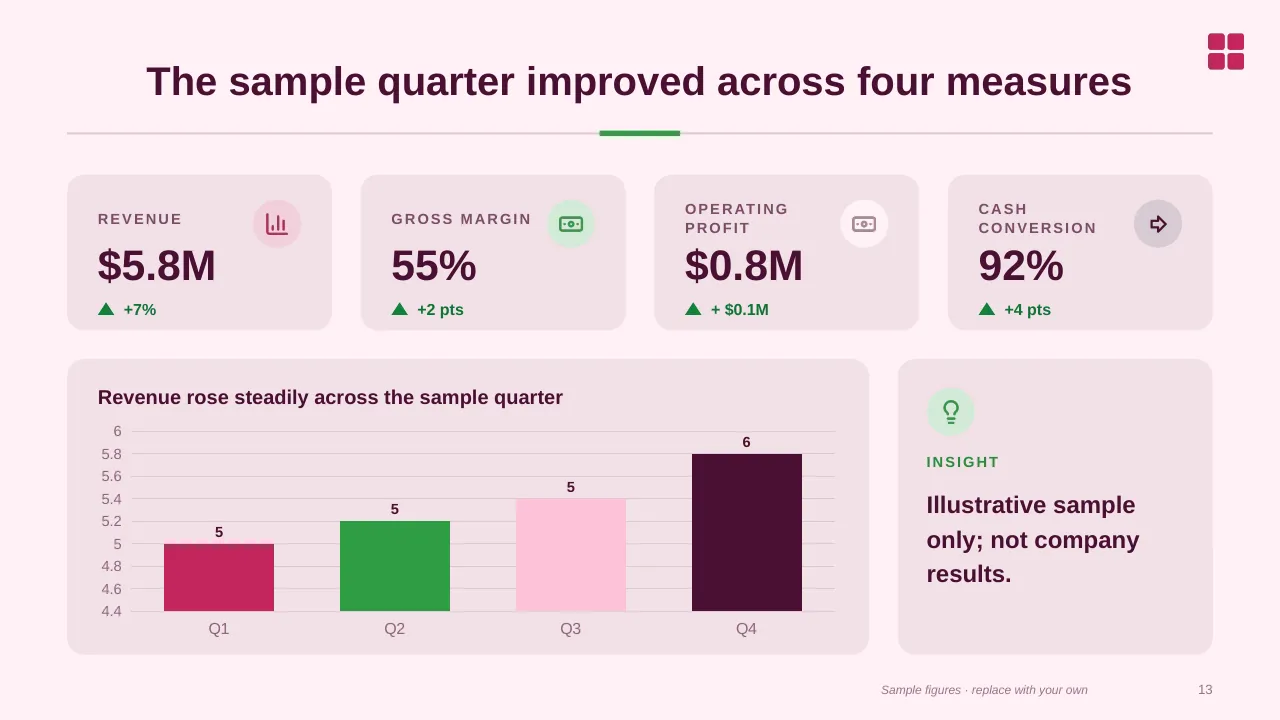
| 13 | The sample quarter improved across four measures |
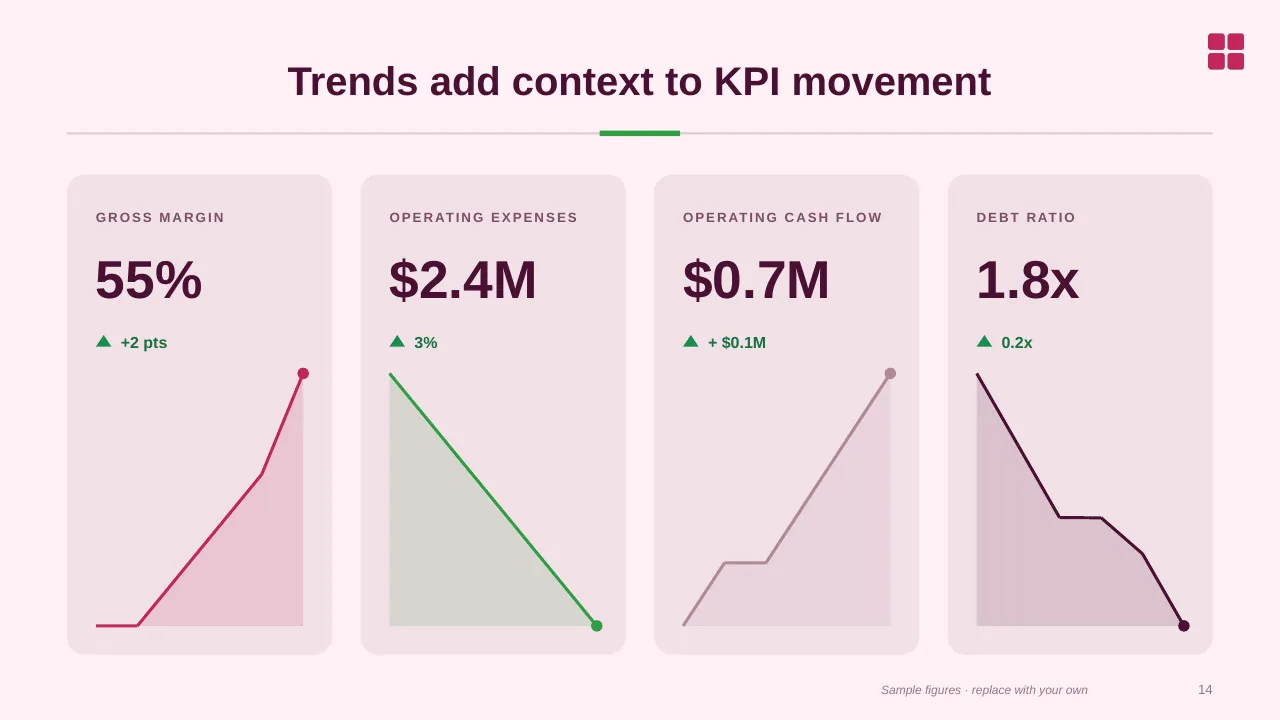
| 14 | Trends add context to KPI movement |
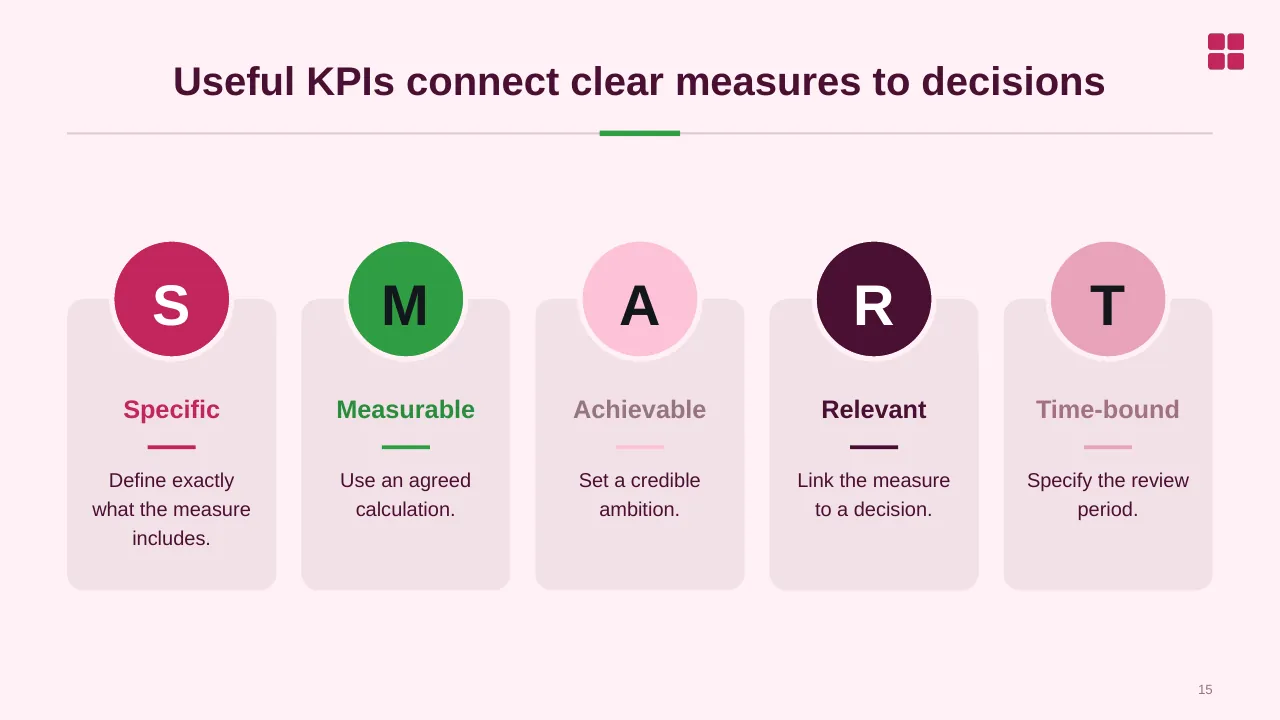
| 15 | Useful KPIs connect clear measures to decisions |
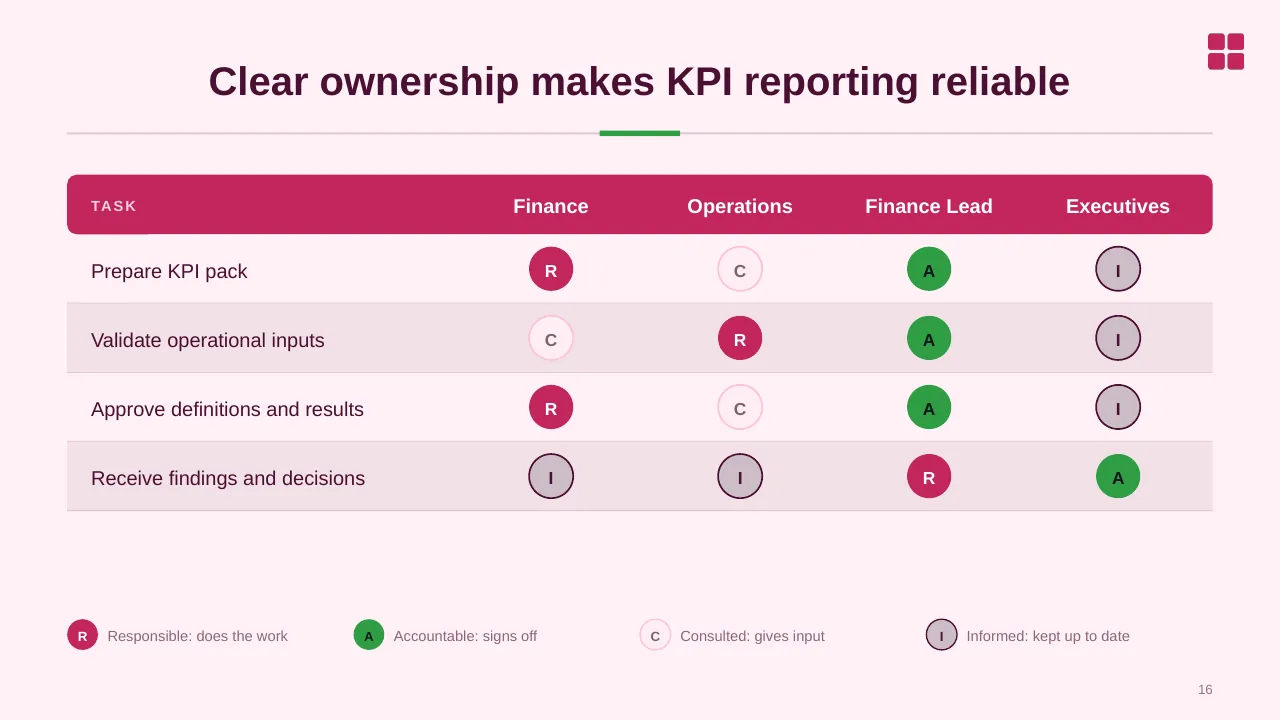
| 16 | Clear ownership makes KPI reporting reliable |
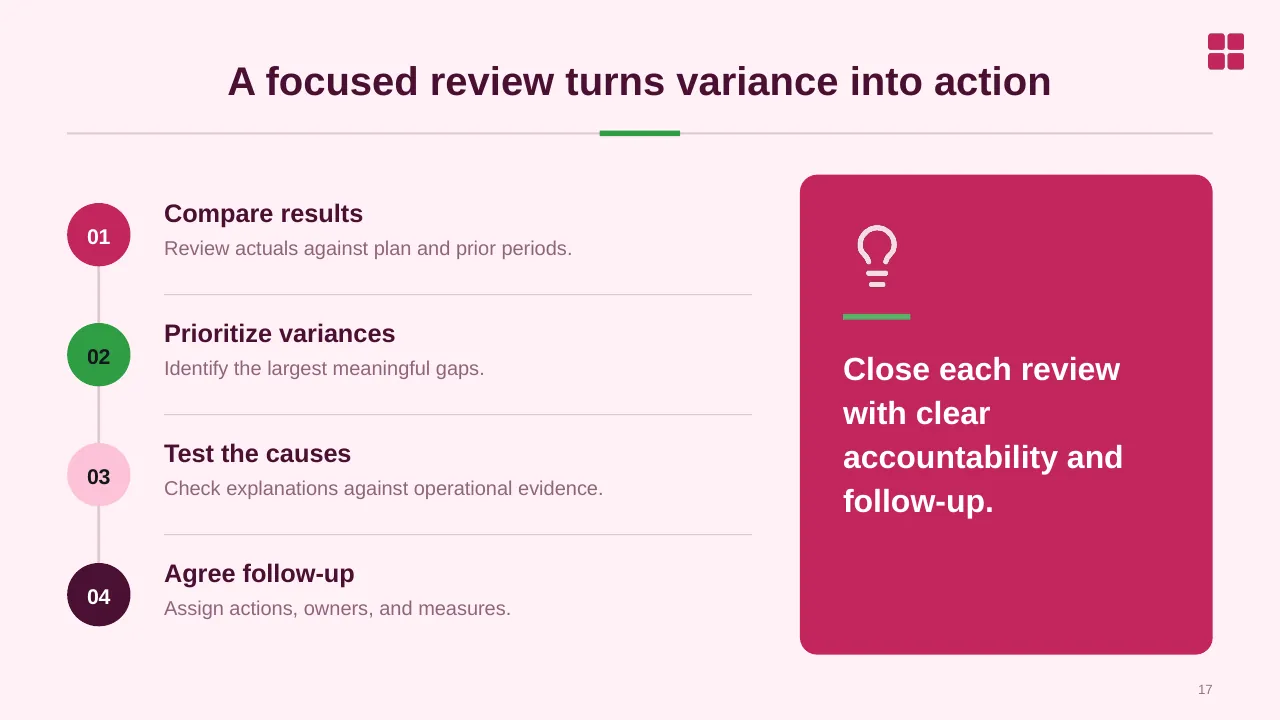
| 17 | A focused review turns variance into action |
| 18 | Reporting risks need practical controls |
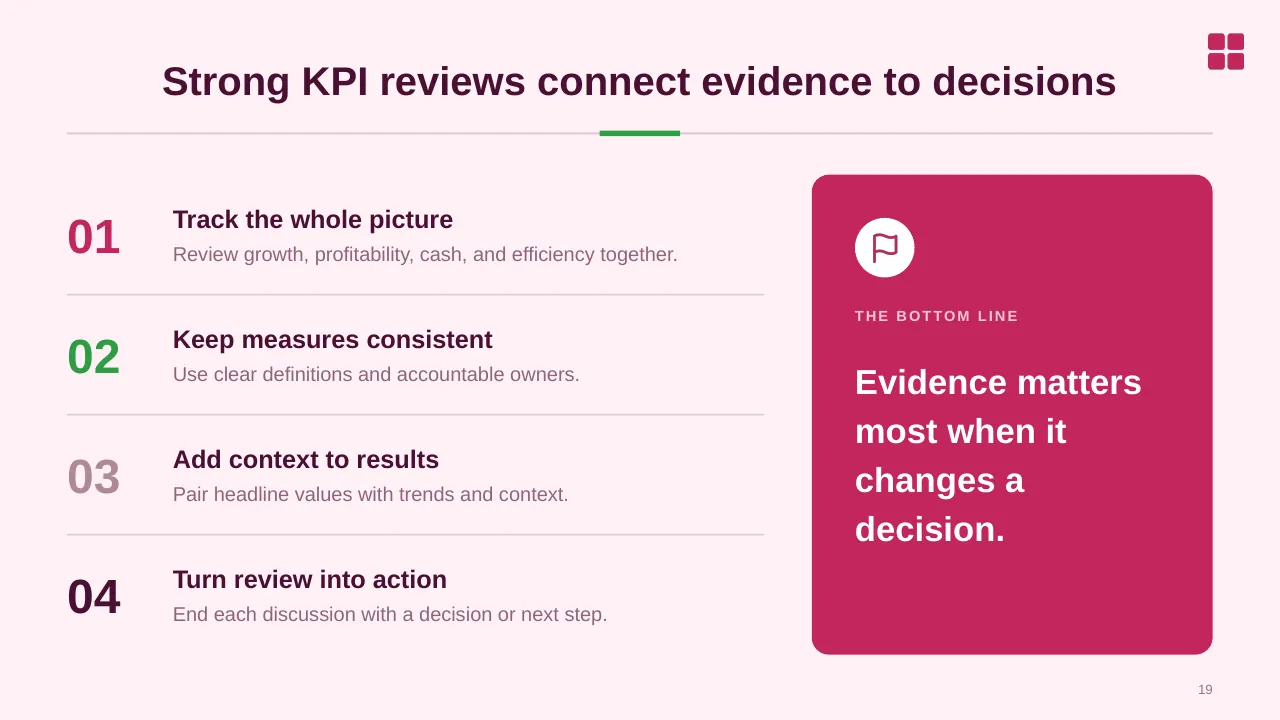
| 19 | Strong KPI reviews connect evidence to decisions |
| 20 | Agree the measures, definitions, owners, and review cadence that matter most. |
Tips for a financial presentation
- Start with three numbers and what they mean.
- Explain variances by driver, not just by line.
- List the main forecast assumptions on one slide.
- Keep detailed tables in the appendix.
Mistakes to avoid
- Dense tables with no message
- Forecasts with hidden assumptions
- No link to decisions
Checklist before you present
- Is there a clear summary?
- Are variances explained?
- Are assumptions visible?
- Are units and periods consistent?
- Is the ask or decision clear?
Great for
- Monthly performance reviews
- Management and board reporting
- Project and portfolio tracking
- HR, finance and operations metrics
How to customise it
- Download the ZIP file and unzip it to get the .pptx presentation.
- Open it in PowerPoint, or upload it to Google Drive and open it with Google Slides.
- Replace the sample text and numbers with your own; charts update from their data sheets.
- Change the theme colours once to recolour the whole deck, then delete any slides you don't need.
Questions about a financial presentation
How do I present budget vs actual?
Show the totals first, then the few lines with the largest variances, each with a one-line reason and the action taken.
Should financial slides use tables or charts?
Use charts for trends and comparisons and small tables for exact figures; avoid full spreadsheets on a slide.
Related presentations
- Employee Headcount Dashboard with Hiring Plans PowerPoint Template
- Monthly Project Report Dashboard PowerPoint Template
- Project Status Dashboard PowerPoint Template
- KPI Dashboard PPT Template
Browse all KPI Dashboards presentations or more dashboard templates.
Template details
| Template | Financial Performance KPI PowerPoint Template |
|---|---|
| Categories | Dashboards, KPI Dashboards |
| File format | PowerPoint (.pptx), delivered as a .zip file |
| Number of slides | 20 fully editable slides |
| File size | 2.3 MB |
| Slide size | 16:9 widescreen |
| Preview images | 20 |
| Editable | Yes: text, colours, shapes, icons and charts |
| Works with | PowerPoint 2010 and later, PowerPoint for Mac, Google Slides |
| Licence | Royalty-free, yours to keep using after your plan ends (terms of use apply) |
| Price | Included in every SlideVilla plan |
| Added | 6 May 2025 |
Questions about this template
Can I edit the Financial Performance KPI PowerPoint Template?
Yes. Every part of the Financial Performance KPI PowerPoint Template is made with native PowerPoint shapes and text boxes, so you can change the wording, colours, fonts and sizes, move or delete elements, and swap icons without losing quality.
Does the Financial Performance KPI PowerPoint Template work in Google Slides?
Yes. Download the .zip file, unzip it to get the .pptx, upload it to Google Drive and open it with Google Slides. The layout, shapes and text stay editable there too.
Is the Financial Performance KPI PowerPoint Template free?
It is a premium template, included in every SlideVilla plan together with the rest of the library. See plans and pricing.
What size and format is it?
It is a PPTX file in 16:9 widescreen format with 20 slides, 2.3 MB (downloaded as a .zip; unzip it to get the presentation), with 20 preview images shown above.
How to use this template
- Step 1DownloadClick Download, then unzip the .zip file to get the .pptx presentation.
- Step 2OpenOpen it in PowerPoint, or upload it to Google Slides from your Drive.
- Step 3Make it yoursChange text, colours, icons and charts. Every element is fully editable.
Categories
Related PowerPoint templates
More designs like this one, ready to edit.