About this PowerPoint template
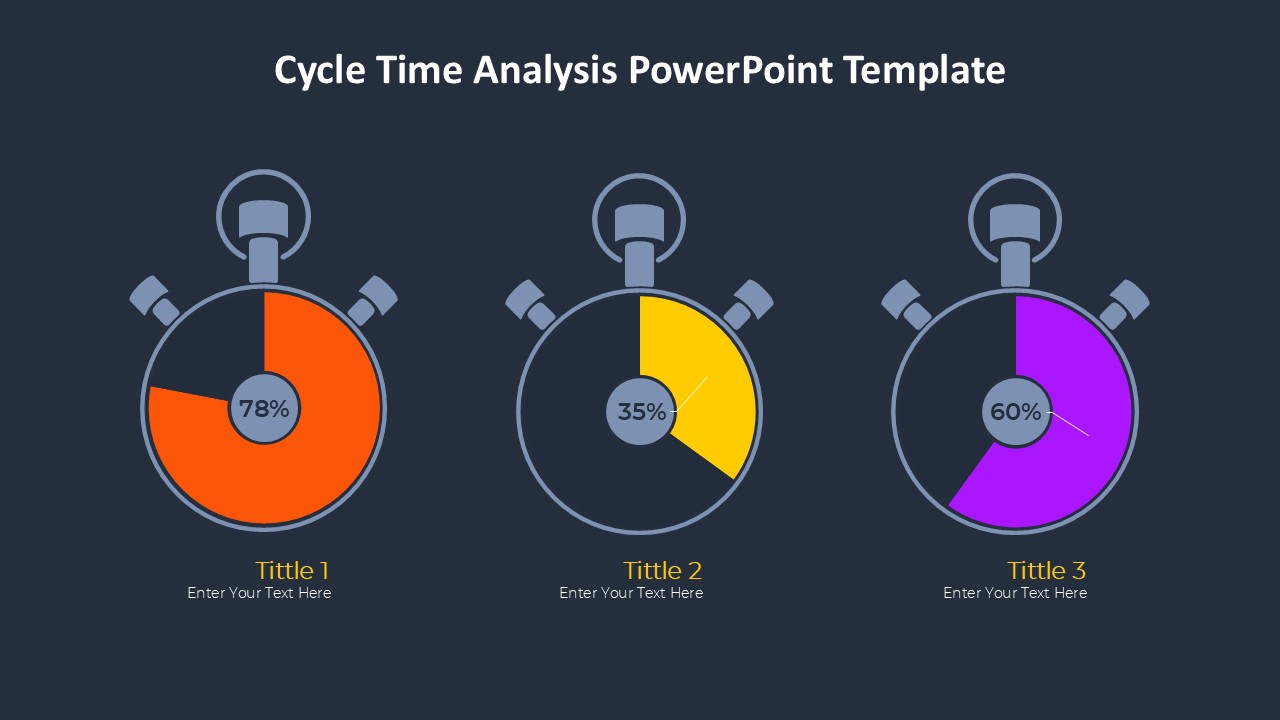
Cycle Charts PowerPoint Template is a versatile and visually appealing presentation tool designed to help you showcase processes, relationships, and interconnected elements in a clear and organized manner.
This professionally designed template features a collection of editable cycle charts with various shapes, styles, and designs to suit your specific needs. Whether you're explaining a complex workflow, illustrating a continuous cycle, or outlining a recurring process, this template offers a wide range of options to effectively communicate your ideas.
The Cycle Charts PowerPoint Template is perfect for business professionals, educators, consultants, and anyone else looking to create engaging and informative presentations. With easy-to-use editing tools, you can quickly customize the charts to match your branding or style preferences. You can change colors, fonts, sizes, and shapes effortlessly to tailor the charts to your exact requirements.
With its clean and modern design, this template ensures that your audience stays focused on the content of your presentation without being distracted by unnecessary clutter. The intuitive layout and user-friendly interface make it simple to navigate through the slides and create a polished and professional-looking presentation in no time.
Key features of the Cycle Charts PowerPoint Template include:
- Fully editable templates that allow you to customize every aspect of the cycle charts
- A variety of visually appealing designs to choose from, including circular, linear, and curved cycles
- Easy-to-use editing tools for quick and seamless customization
- Clean and modern layout to keep your audience engaged
- Suitable for a wide range of industries and presentation topics
Overall, the Cycle Charts PowerPoint Template is a valuable resource for anyone looking to create impactful presentations that effectively communicate complex ideas and processes. Upgrade your presentation game today with this comprehensive and user-friendly template!
Template details
| Template | Cycle Charts PowerPoint Template |
|---|---|
| Category | PowerPoint Templates |
| File format | PowerPoint (.pptx) |
| Slide size | 16:9 widescreen |
| Preview images | 1 |
| Editable | Yes: text, colours, shapes, icons and charts |
| Works with | PowerPoint 2010 and later, PowerPoint for Mac, Google Slides |
| Licence | Royalty-free, yours to keep using after your plan ends (terms of use apply) |
| Price | Included in every SlideVilla plan |
| Added | 2 Oct 2024 |
Questions about this template
Can I edit the Cycle Charts PowerPoint Template?
Yes. Every part of the Cycle Charts PowerPoint Template is made with native PowerPoint shapes and text boxes, so you can change the wording, colours, fonts and sizes, move or delete elements, and swap icons without losing quality.
Does the Cycle Charts PowerPoint Template work in Google Slides?
Yes. Download the .pptx file, upload it to Google Drive and open it with Google Slides. The layout, shapes and text stay editable there too.
Is the Cycle Charts PowerPoint Template free?
It is a premium template, included in every SlideVilla plan together with the rest of the library. See plans and pricing.
What size and format is it?
It is a PPTX file in 16:9 widescreen format, with 1 preview image shown above.
How to use this template
- Step 1DownloadClick Download and the .pptx file saves straight to your computer.
- Step 2OpenOpen it in PowerPoint, or upload it to Google Slides from your Drive.
- Step 3Make it yoursChange text, colours, icons and charts. Every element is fully editable.
Categories
Related PowerPoint templates
More designs like this one, ready to edit.