About this PowerPoint template
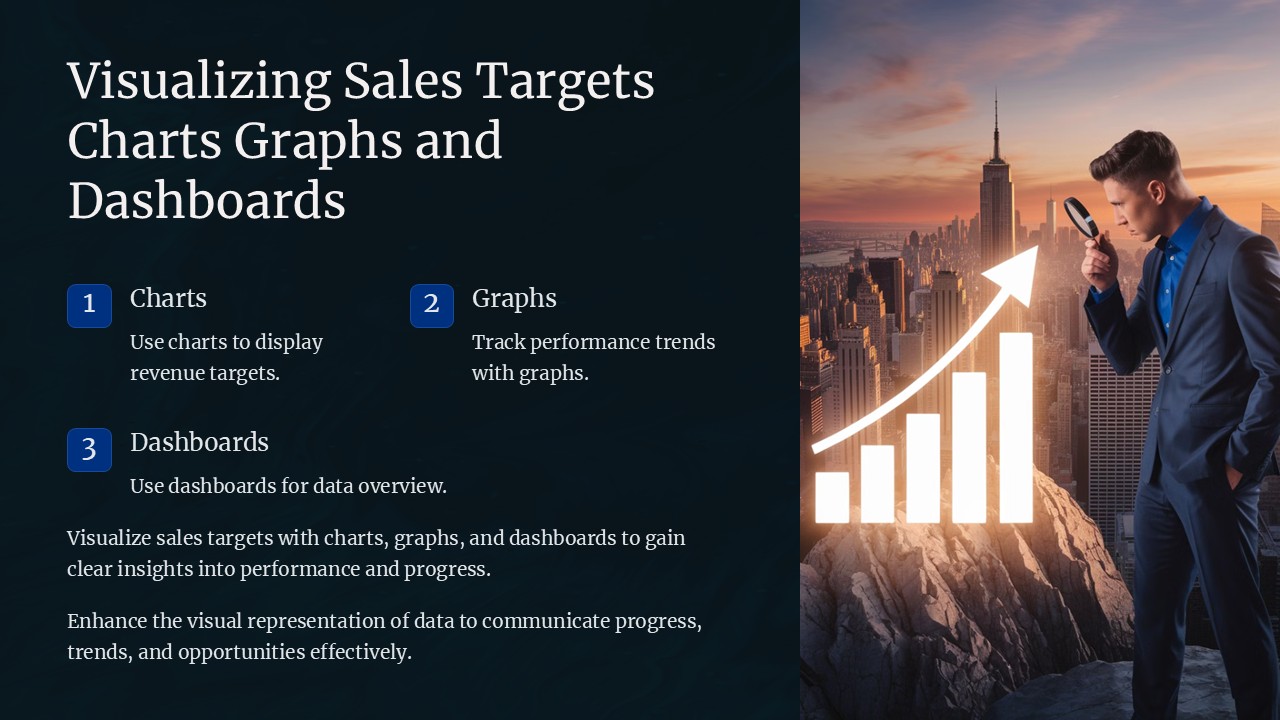
Visualizing Sales Targets: Charts, Graphs, and Dashboards PowerPoint Presentation
Unlock the full potential of your sales data with the "Visualizing Sales Targets: Charts, Graphs, and Dashboards PowerPoint Presentation." This comprehensive PowerPoint template is designed to help professionals across all sectors effectively communicate their sales targets and achievements. Whether you're presenting to stakeholders, team members, or potential investors, this tool will empower you to present your data in a clear, visually engaging manner.
With this PowerPoint presentation, you can transform complex sales data into easy-to-understand visuals that highlight key information and foster actionable insights. The template includes a variety of pre-designed slides, each tailored to showcase different aspects of sales data through innovative graphical representations.
Key Components:
- Sales Performance Dashboards: Get ready-to-use dashboard slides that provide a holistic view of sales performance against targets. These dashboards combine aesthetics with functionality, allowing you to track progress, identify trends, and make strategic decisions swiftly.
- Target Achievement Graphs: Utilize a range of graph styles, including bar graphs, line charts, and pie charts, to illustrate how your sales figures stack up against set targets. These graphs are not only visually appealing but also customizable to reflect specific data points.
- Comparative Analysis Layouts: Compare current sales performance with past data or against the competition with dual-axis charts and comparative layouts. This feature is particularly useful for quarterly reviews and strategic planning sessions.
- Forecasting Models: Project future sales and set realistic targets with forecasting slides that let you input historical data and visualize potential growth trajectories.
- Interactive Elements: Engage your audience with interactive slides that allow for real-time data manipulation. Adjust variables to see potential outcomes, making your presentation not just informative but also interactive.
Customization and Usability:
Designed with the user in mind, every slide in the "Visualizing Sales Targets" presentation is fully editable. You can easily adjust colors, text, and graphics to match your company's branding or to highlight particular data. The templates support both PowerPoint and Google Slides, ensuring compatibility and flexibility regardless of your preferred presentation software.
Features:
- Fully Editable Templates: Tailor each slide to your specific needs without any hassle. Change colors, modify shapes, and replace text areas effortlessly to fit your data and branding.
- Supports PowerPoint and Google Slides: Whether you are a Microsoft Office veteran or a Google Slides enthusiast, this template works seamlessly across both platforms, giving you the flexibility to present from virtually anywhere.
- Drag and Drop Functionality: Customizing your charts and graphs is as easy as dragging and dropping elements within the slides. This feature simplifies the process of data representation, making it accessible even for those with minimal graphic design experience.
- Wide Variety of Chart Types: Choose from an extensive array of chart types to best represent your data. Each type is designed to be as informative as it is attractive, ensuring your data stands out.
The "Visualizing Sales Targets: Charts, Graphs, and Dashboards PowerPoint Presentation" is an indispensable tool for anyone who needs to report on sales performance and forecasts. It not only enhances how you visualize and present data but also improves how your audience perceives and interacts with the information. Equip your presentations with the power of professional, dynamic sales visualization and make every data point count!
Template details
| Template | Visualizing Sales Targets Charts Graphs and Dashboards PowerPoint Presentation |
|---|---|
| Category | PowerPoint Presentations |
| File format | PowerPoint (.pptx) |
| Slide size | 16:9 widescreen |
| Preview images | 1 |
| Editable | Yes: text, colours, shapes, icons and charts |
| Works with | PowerPoint 2010 and later, PowerPoint for Mac, Google Slides |
| Licence | Royalty-free, yours to keep using after your plan ends (terms of use apply) |
| Price | Included in every SlideVilla plan |
| Added | 27 Apr 2025 |
Questions about this template
Can I edit the Visualizing Sales Targets Charts Graphs and Dashboards PowerPoint Presentation?
Yes. Every part of the Visualizing Sales Targets Charts Graphs and Dashboards PowerPoint Presentation is made with native PowerPoint shapes and text boxes, so you can change the wording, colours, fonts and sizes, move or delete elements, and swap icons without losing quality.
Does the Visualizing Sales Targets Charts Graphs and Dashboards PowerPoint Presentation work in Google Slides?
Yes. Download the .pptx file, upload it to Google Drive and open it with Google Slides. The layout, shapes and text stay editable there too.
Is the Visualizing Sales Targets Charts Graphs and Dashboards PowerPoint Presentation free?
It is a premium template, included in every SlideVilla plan together with the rest of the library. See plans and pricing.
What size and format is it?
It is a PPTX file in 16:9 widescreen format, with 1 preview image shown above.
How to use this template
- Step 1DownloadClick Download and the .pptx file saves straight to your computer.
- Step 2OpenOpen it in PowerPoint, or upload it to Google Slides from your Drive.
- Step 3Make it yoursChange text, colours, icons and charts. Every element is fully editable.
Categories
Related PowerPoint templates
More designs like this one, ready to edit.