About this PowerPoint template
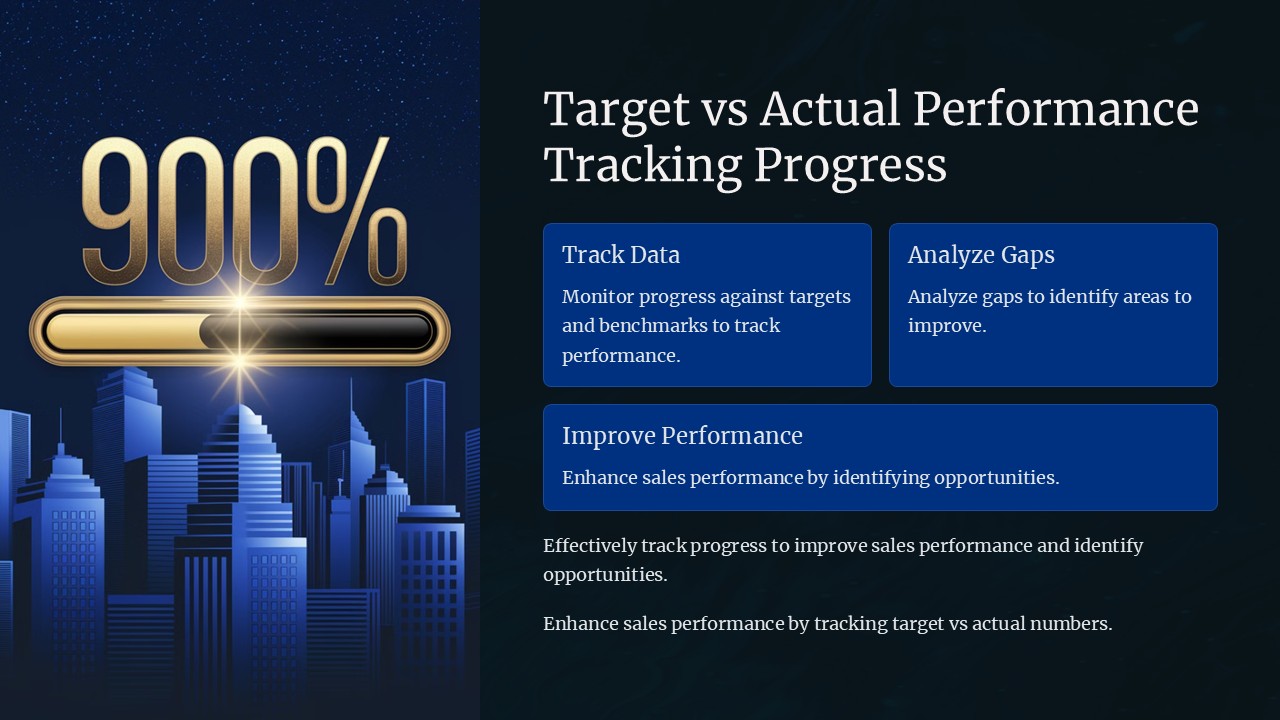
The Tracking Key Performance Indicators PowerPoint Presentation is a comprehensive and visually appealing tool designed to help businesses track and analyze their key performance indicators (KPIs) effectively. This professionally designed presentation template is perfect for professionals and organizations looking to showcase their KPI data in a clear and concise manner.
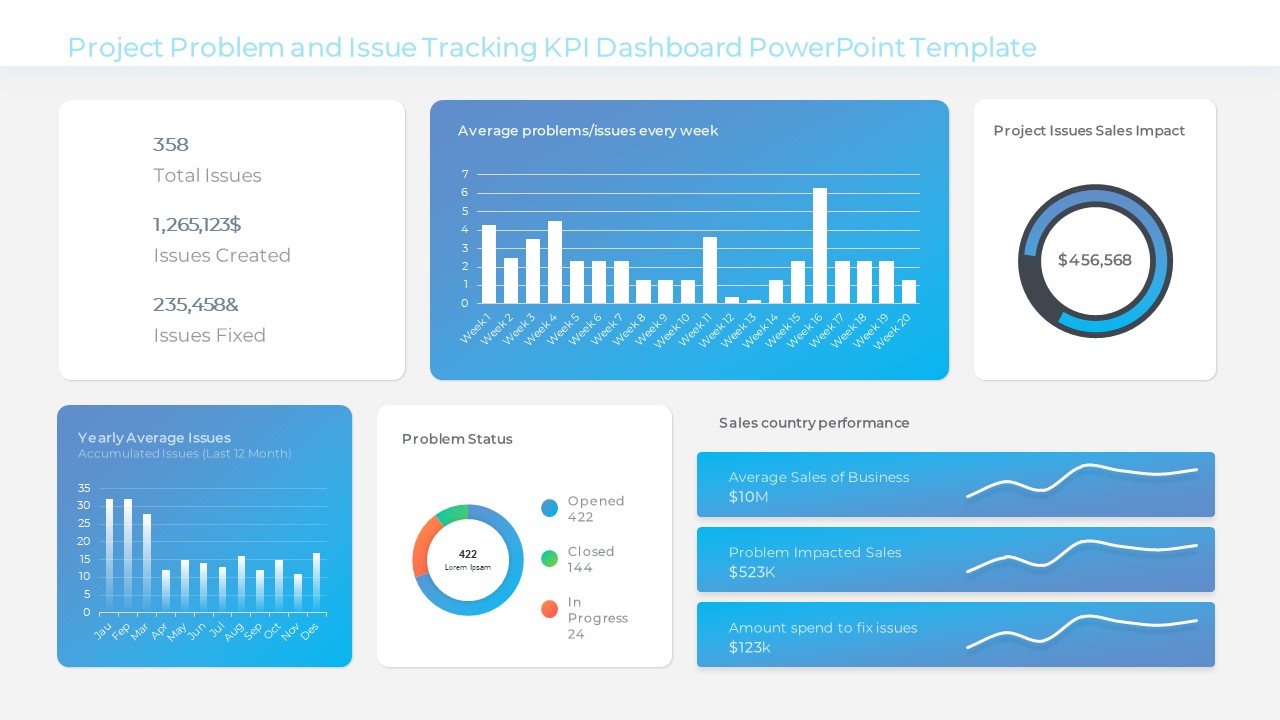
The presentation features a clean and modern design with easy-to-read charts, graphs, and diagrams that make it easy to present complex KPI data to stakeholders and decision-makers. With a range of slide layouts and color schemes to choose from, this PowerPoint template can be customized to suit any brand or industry.
Key Features:
- Fully editable templates: Customize the presentation slides with your own data, visuals, and branding elements to create a personalized and professional-looking presentation.
- Easy-to-use charts and graphs: Present KPI data in a visually appealing way with a range of chart and graph options that can be easily updated and modified.
- Data-driven design: Showcase your KPI metrics using data-driven visuals that clearly communicate performance trends, targets, and achievements.
- Professional layout: The presentation template includes a variety of slide layouts, including title slides, content slides, and section dividers, to help you organize and structure your KPI data effectively.
- Easy to download and use: Simply download the PowerPoint template, add your content, and start presenting your KPI data with confidence.
Overall, the Tracking Key Performance Indicators PowerPoint Presentation is a versatile and user-friendly tool that can help businesses track, analyze, and communicate their KPI data with ease. Whether you're preparing for a board meeting, client presentation, or internal review, this presentation template will help you showcase your key performance indicators in a compelling and impactful way.
Template details
| Template | Tracking Key Performance Indicators PowerPoint Presentation |
|---|---|
| Category | PowerPoint Presentations |
| File format | PowerPoint (.pptx) |
| Slide size | 16:9 widescreen |
| Preview images | 1 |
| Editable | Yes: text, colours, shapes, icons and charts |
| Works with | PowerPoint 2010 and later, PowerPoint for Mac, Google Slides |
| Licence | Royalty-free, yours to keep using after your plan ends (terms of use apply) |
| Price | Included in every SlideVilla plan |
| Added | 9 Feb 2025 |
Questions about this template
Can I edit the Tracking Key Performance Indicators PowerPoint Presentation?
Yes. Every part of the Tracking Key Performance Indicators PowerPoint Presentation is made with native PowerPoint shapes and text boxes, so you can change the wording, colours, fonts and sizes, move or delete elements, and swap icons without losing quality.
Does the Tracking Key Performance Indicators PowerPoint Presentation work in Google Slides?
Yes. Download the .pptx file, upload it to Google Drive and open it with Google Slides. The layout, shapes and text stay editable there too.
Is the Tracking Key Performance Indicators PowerPoint Presentation free?
It is a premium template, included in every SlideVilla plan together with the rest of the library. See plans and pricing.
What size and format is it?
It is a PPTX file in 16:9 widescreen format, with 1 preview image shown above.
How to use this template
- Step 1DownloadClick Download and the .pptx file saves straight to your computer.
- Step 2OpenOpen it in PowerPoint, or upload it to Google Slides from your Drive.
- Step 3Make it yoursChange text, colours, icons and charts. Every element is fully editable.
Categories
Related PowerPoint templates
More designs like this one, ready to edit.