

About this PowerPoint template
The Supply Chain Management PPT Template is a complete 25-slide presentation: how goods, information, and decisions connect from suppliers to customers. Every slide is fully editable in PowerPoint and Google Slides, so you can change the text, colours, charts and icons to fit your brand in minutes.
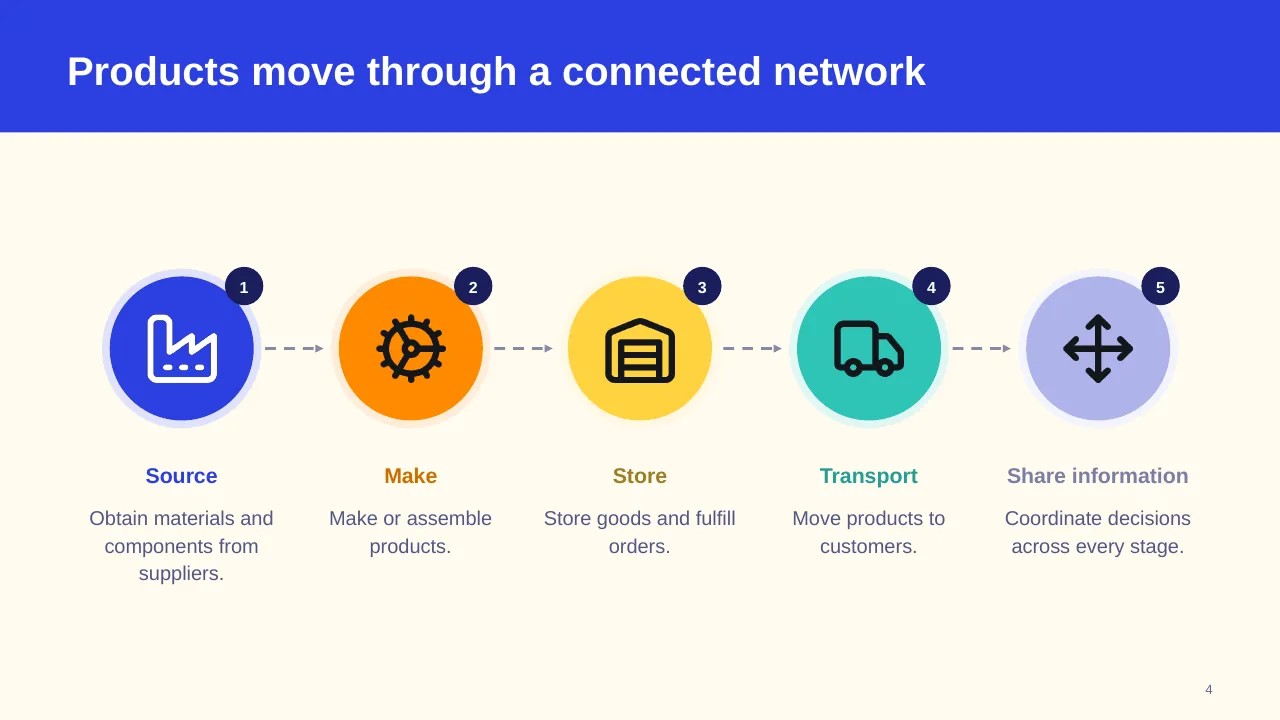
Inside, the slides walk through topics such as “Products move through a connected network”, “Broader supplier markets expand sourcing options” and “Prioritize improvements by value and sequence”, with ready-made layouts for each step. It is part of our Operations & Supply Chain presentations.
On this page
What's included
- 25 professionally designed 16:9 widescreen slides
- 100% editable text, shapes, icons, tables and charts (no flat images)
- Works in Microsoft PowerPoint (Windows and Mac) and Google Slides
- Clean, consistent layout that follows your theme colours and fonts
- Delivered as a single ZIP file containing the .pptx presentation
What to include in a supply chain presentation
A simple structure that works for most audiences, mapped to the slides in this deck:
| Part | What goes there | Slide in this deck |
|---|---|---|
| Network overview | Suppliers, sites, flows and key partners | Slides 4, 17, 21 |
| Performance | Cost, service, inventory and lead times | Slides 7, 9, 11 |
| Risks | Single sources, regions, capacity and visibility gaps | Slides 9, 11 |
| Improvement plan | Resilience, cost and digital initiatives | Slides 8, 14, 22 |
| Roadmap and owners | Timeline and accountabilities | Use any content slide |
Key numbers: Supply chain
Research figures you can quote on your slides. Each one names the study it comes from, so your audience can check it.
| Finding | Figure | Source |
|---|---|---|
| How often a supply chain disruption of a month or longer occurs | about every 3.7 years | McKinsey Global Institute (2020) |
| Profit lost to disruptions over a decade, average company | about 45% of one year's profits | McKinsey Global Institute (2020) |
| Executives without clear visibility beyond Tier 1 suppliers | 54% | McKinsey Global Institute (2020) |
| Supply chain leaders saying they lack the talent to meet digitisation goals | about 90% | McKinsey supply chain leaders survey |
Sources: McKinsey, What is supply chain? · McKinsey, Reimagining supply chain resilience · World Economic Forum on McKinsey data. Figures are from the editions named; check for a newer edition before you present.
Slide-by-slide outline
| Slide | What it covers |
|---|---|
| 1 | Title slide: Supply Chain Management |
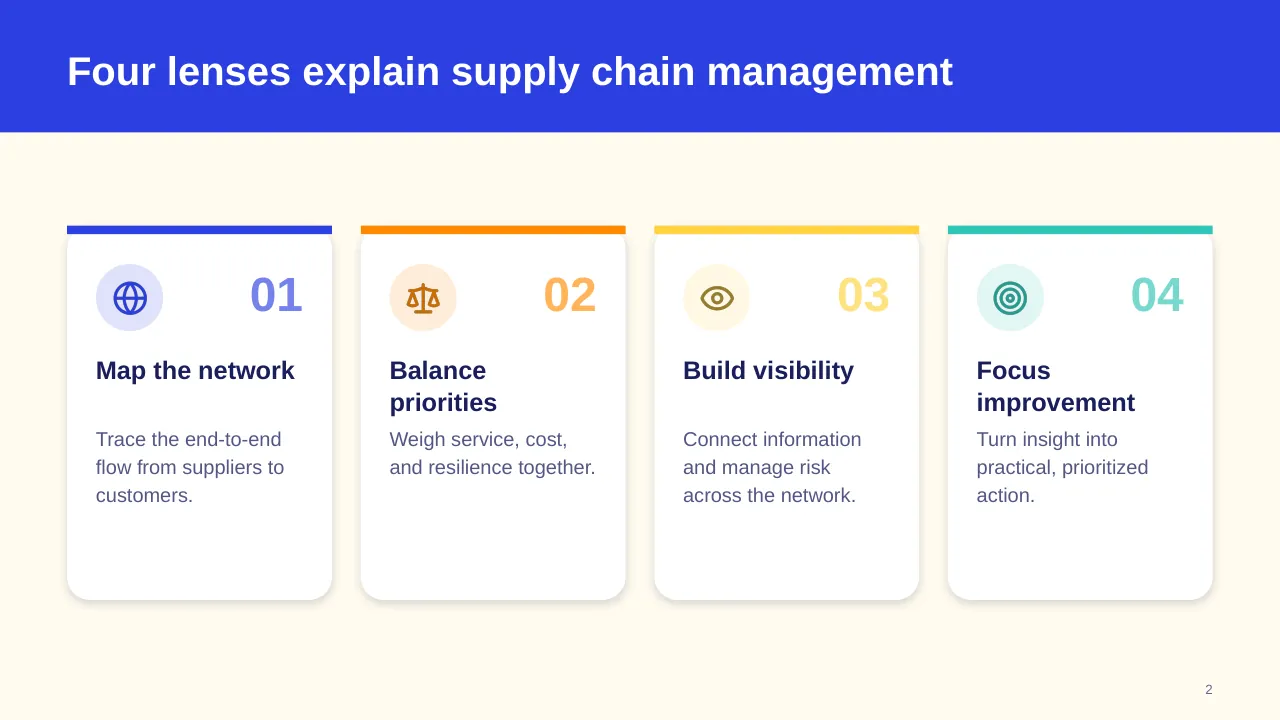
| 2 | Four lenses explain supply chain management |
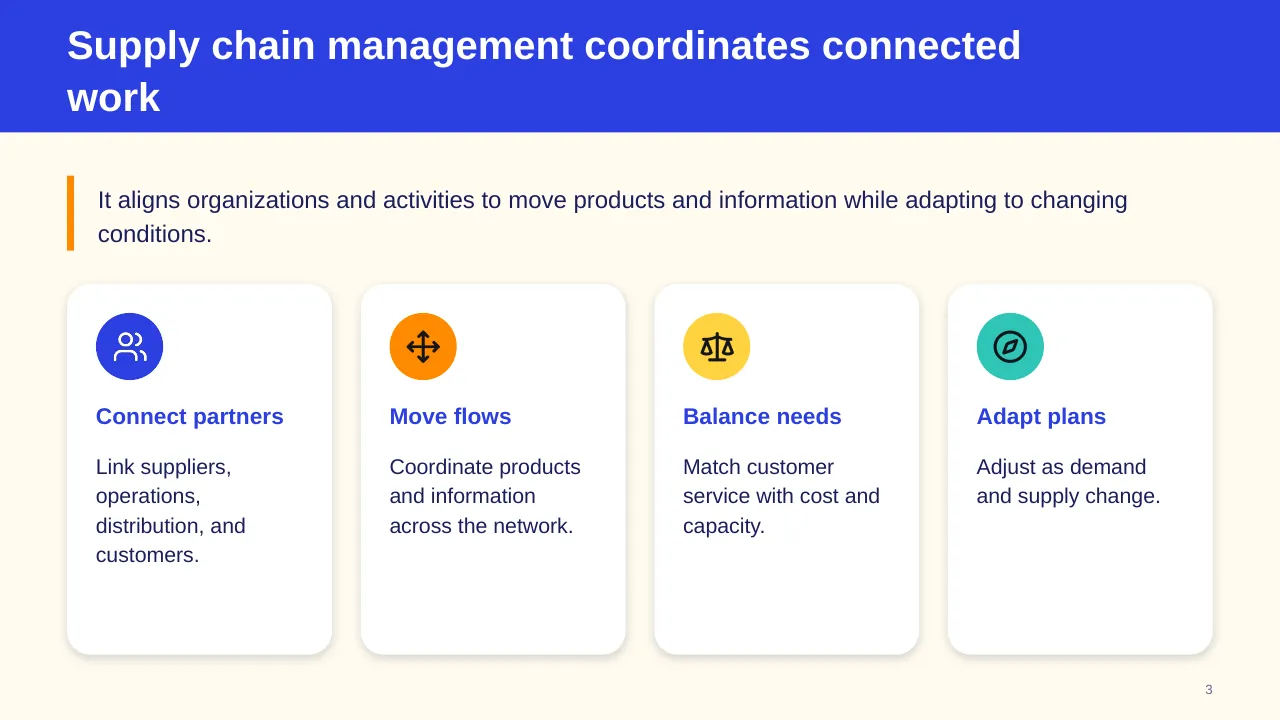
| 3 | It aligns organizations and activities to move products and information while adapting to changing conditions. |
| 4 | Products move through a connected network |
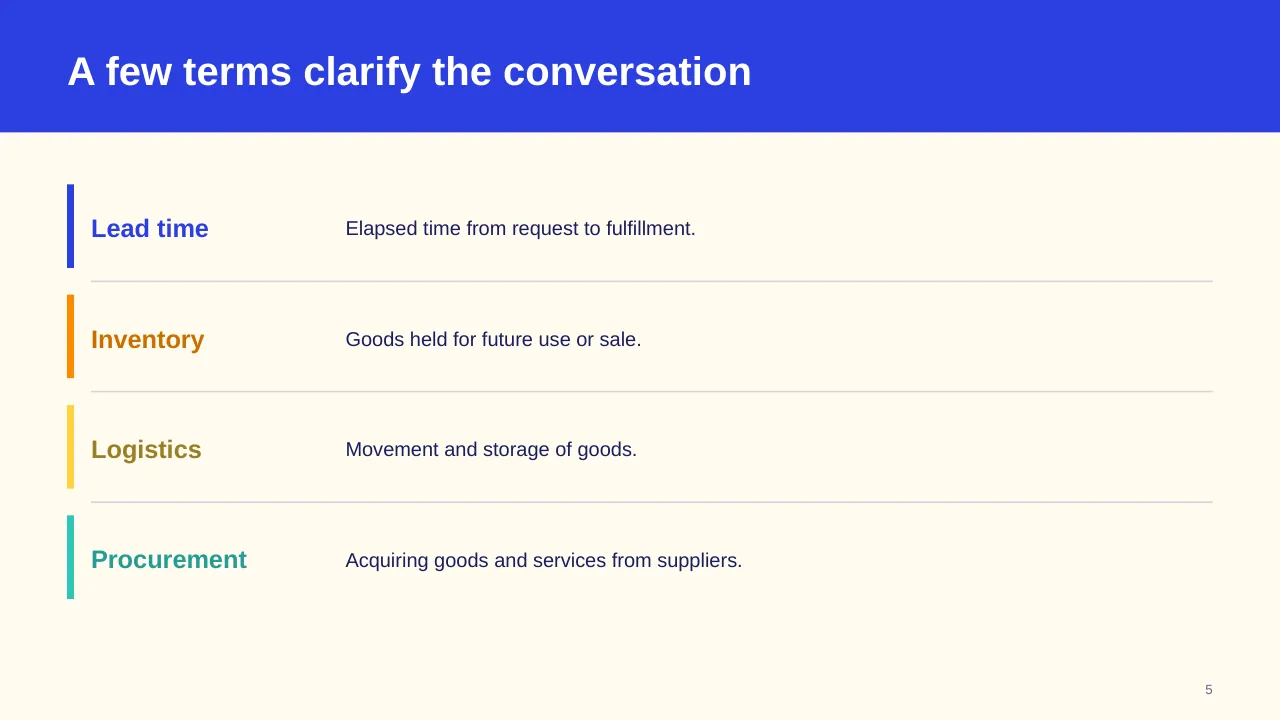
| 5 | Elapsed time from request to fulfillment. |
| 6 | Supply chains connect sourcing, operations, inventory, information, and delivery. |
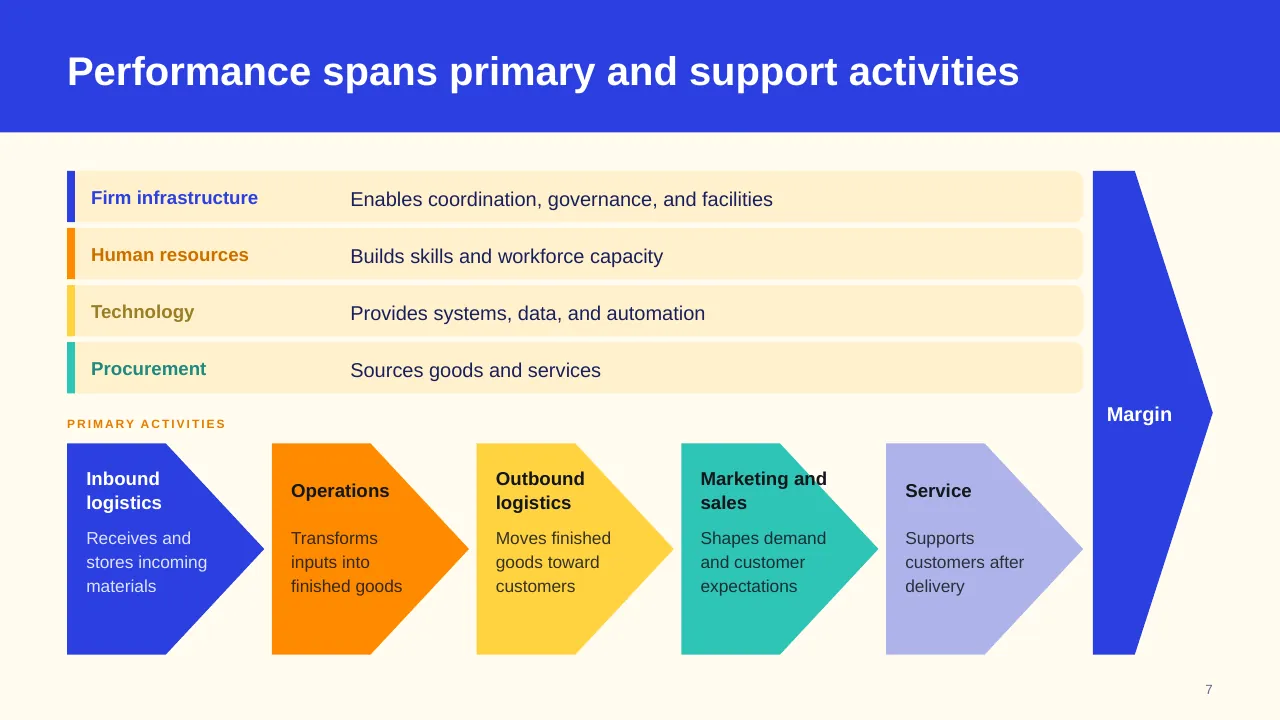
| 7 | Performance spans primary and support activities |
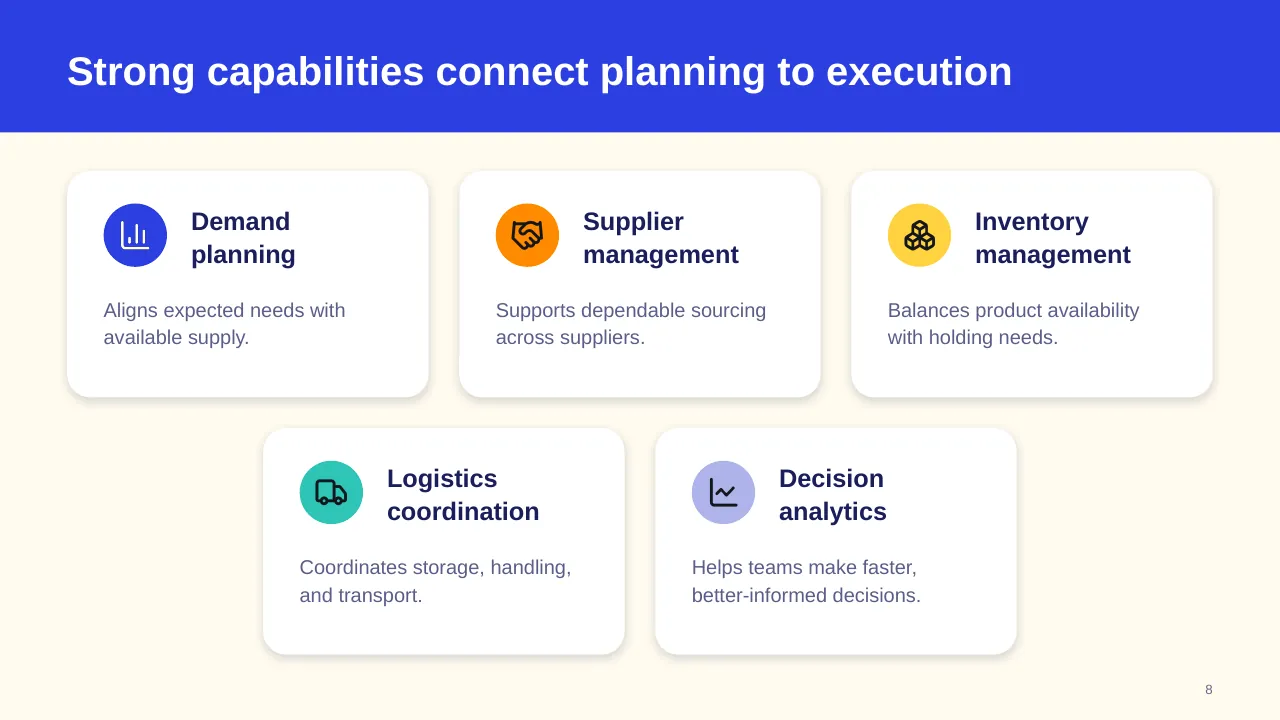
| 8 | Strong capabilities connect planning to execution |
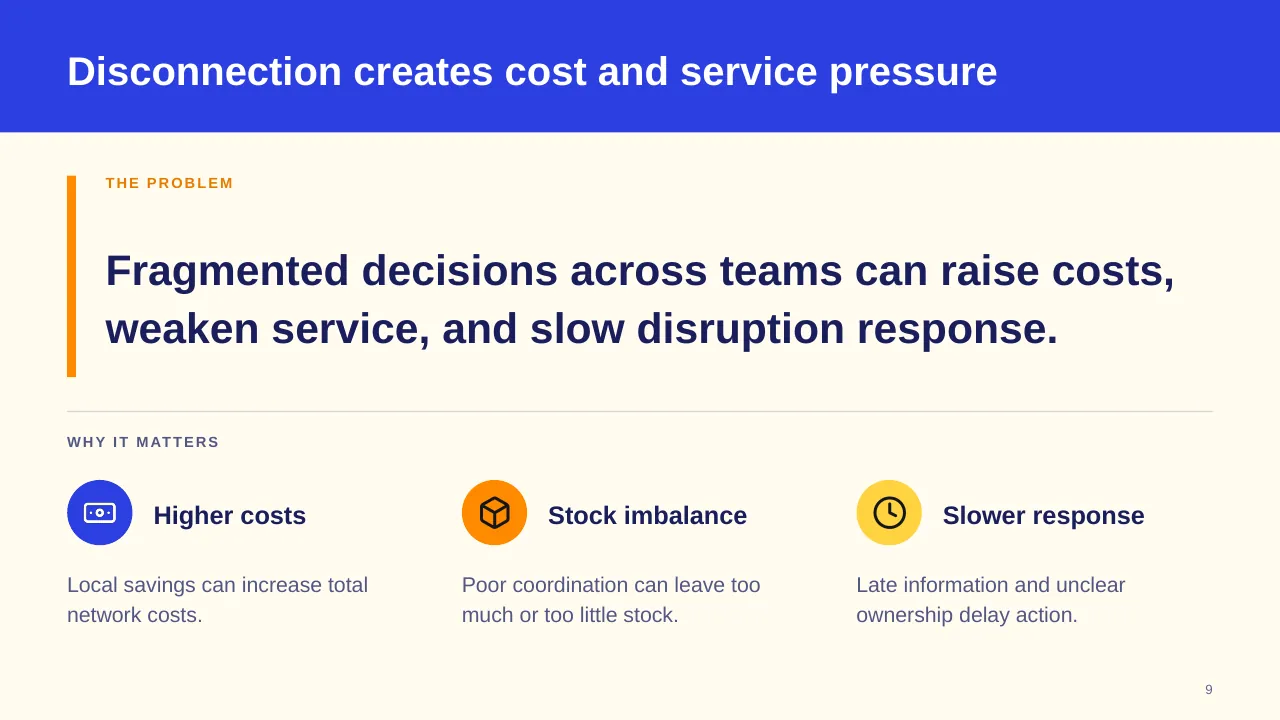
| 9 | Fragmented decisions across teams can raise costs, weaken service, and slow disruption response. |
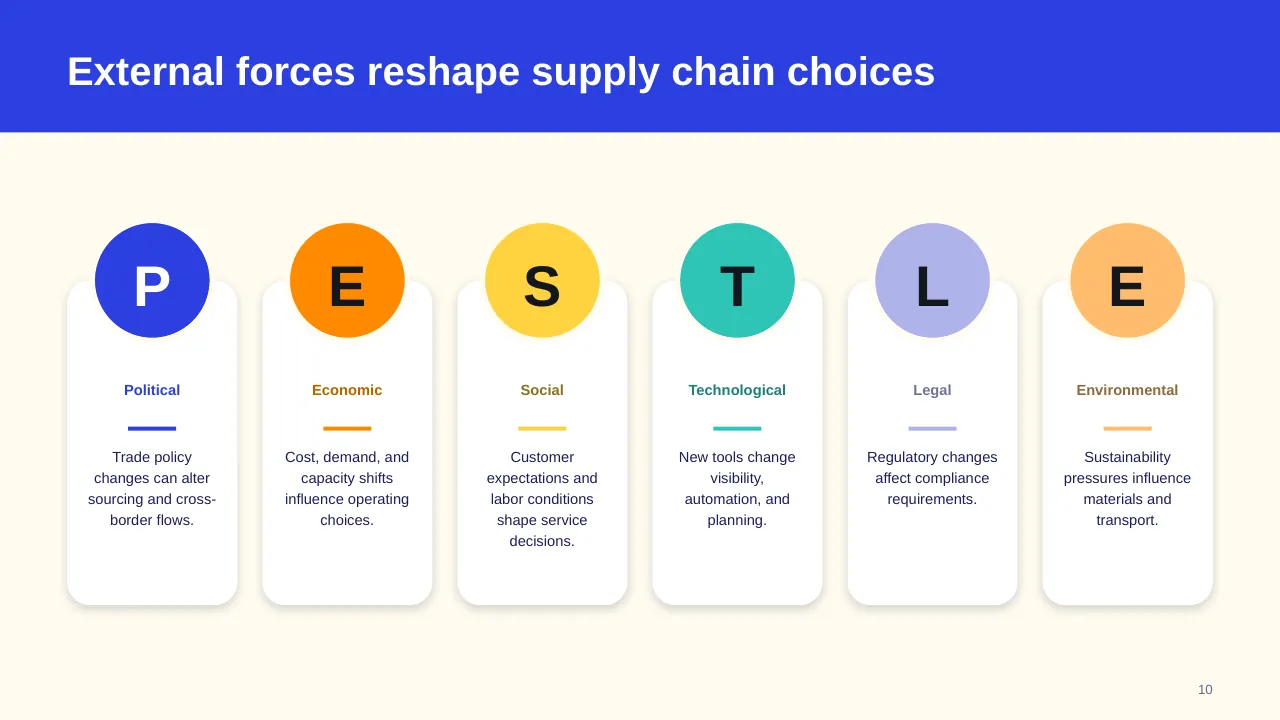
| 10 | External forces reshape supply chain choices |
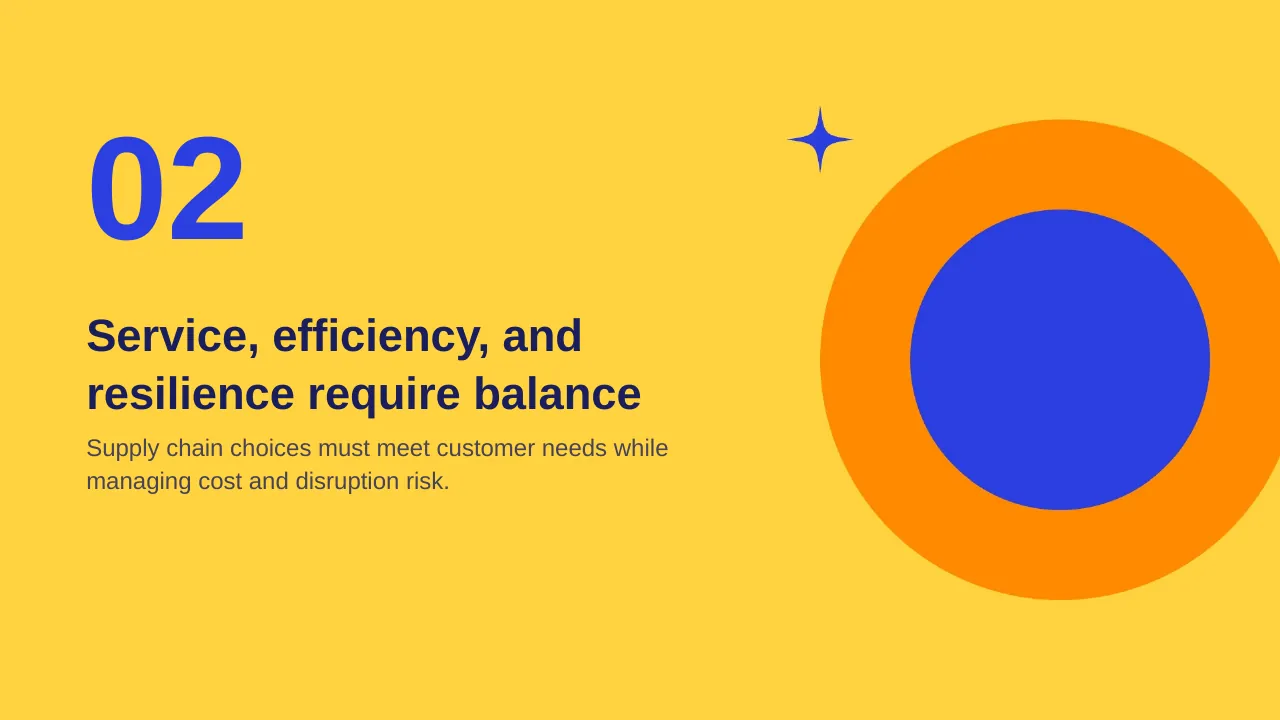
| 11 | Supply chain choices must meet customer needs while managing cost and disruption risk. |
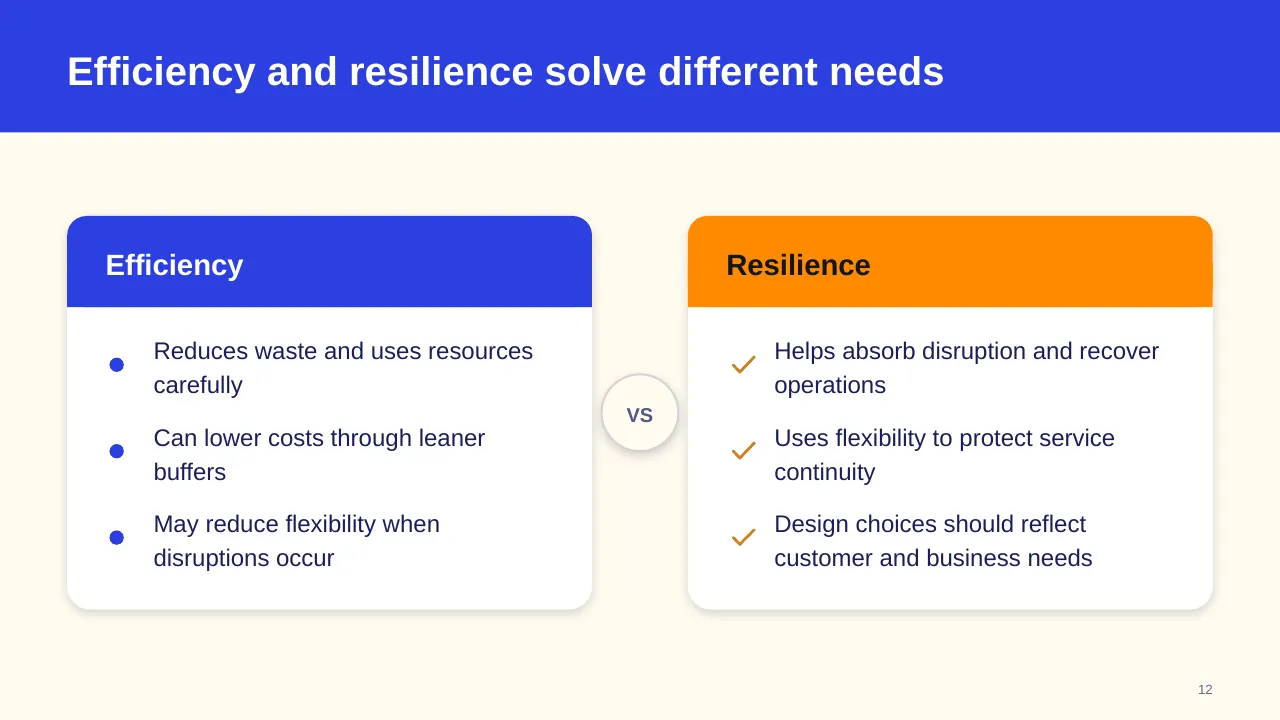
| 12 | Efficiency and resilience solve different needs |
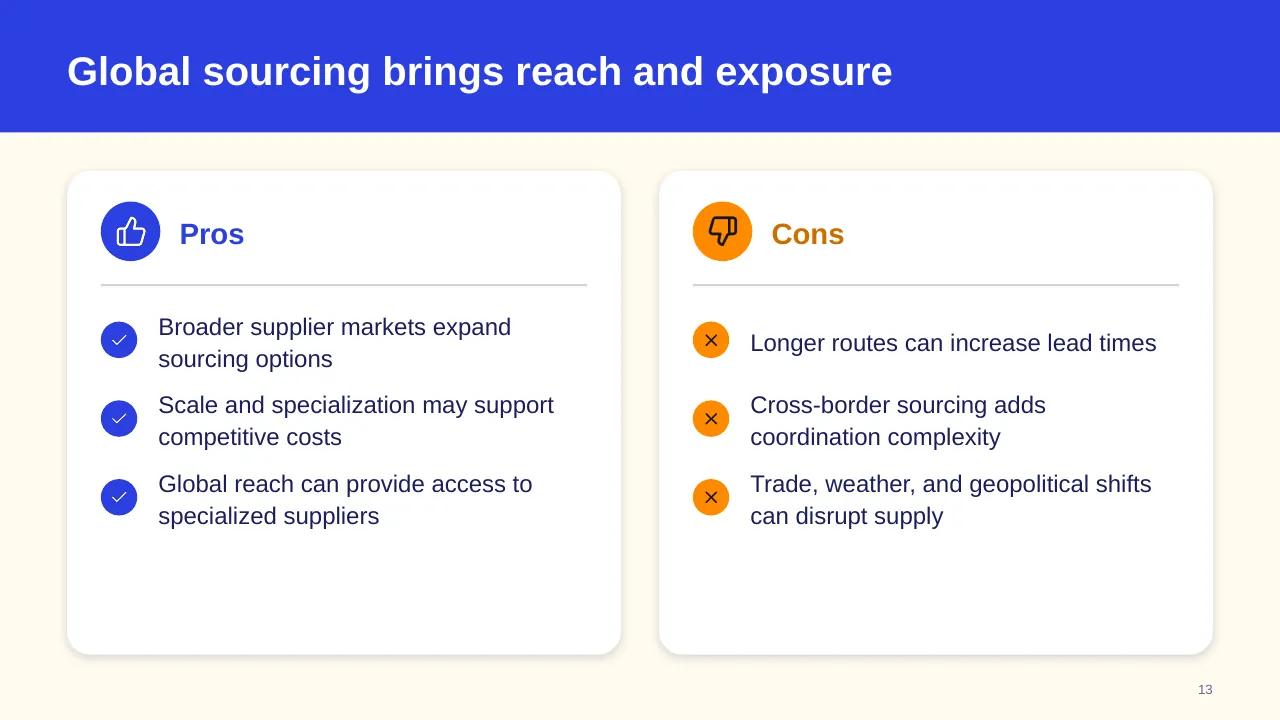
| 13 | Broader supplier markets expand sourcing options |
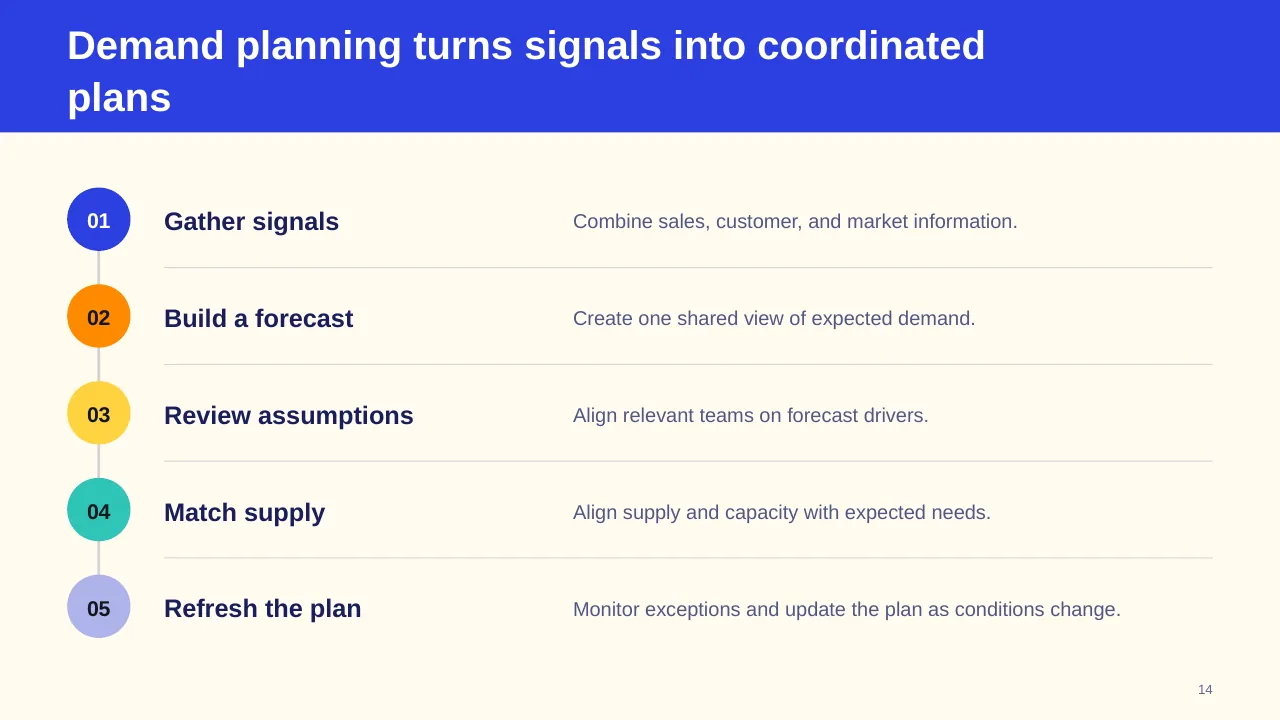
| 14 | Demand planning turns signals into coordinated plans |
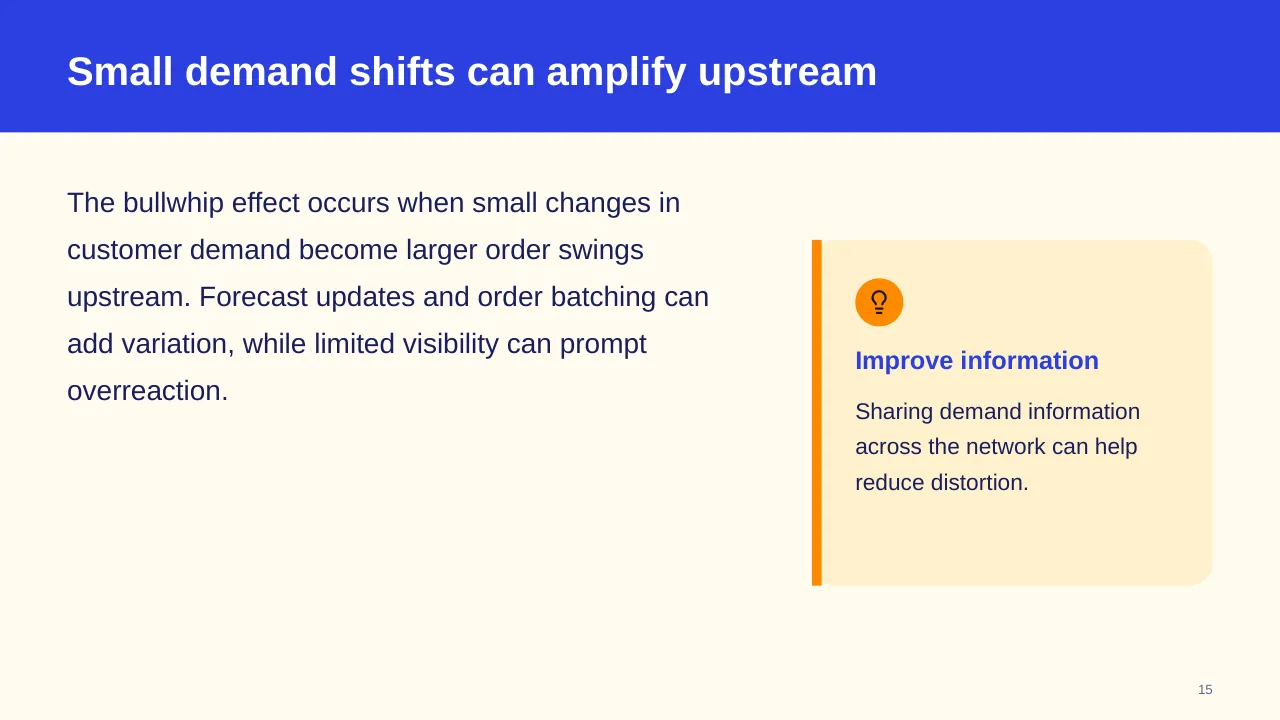
| 15 | The bullwhip effect occurs when small changes in customer demand become larger order swings upstream.… |
| 16 | Timely information and coordination help teams respond to operating trade-offs. |
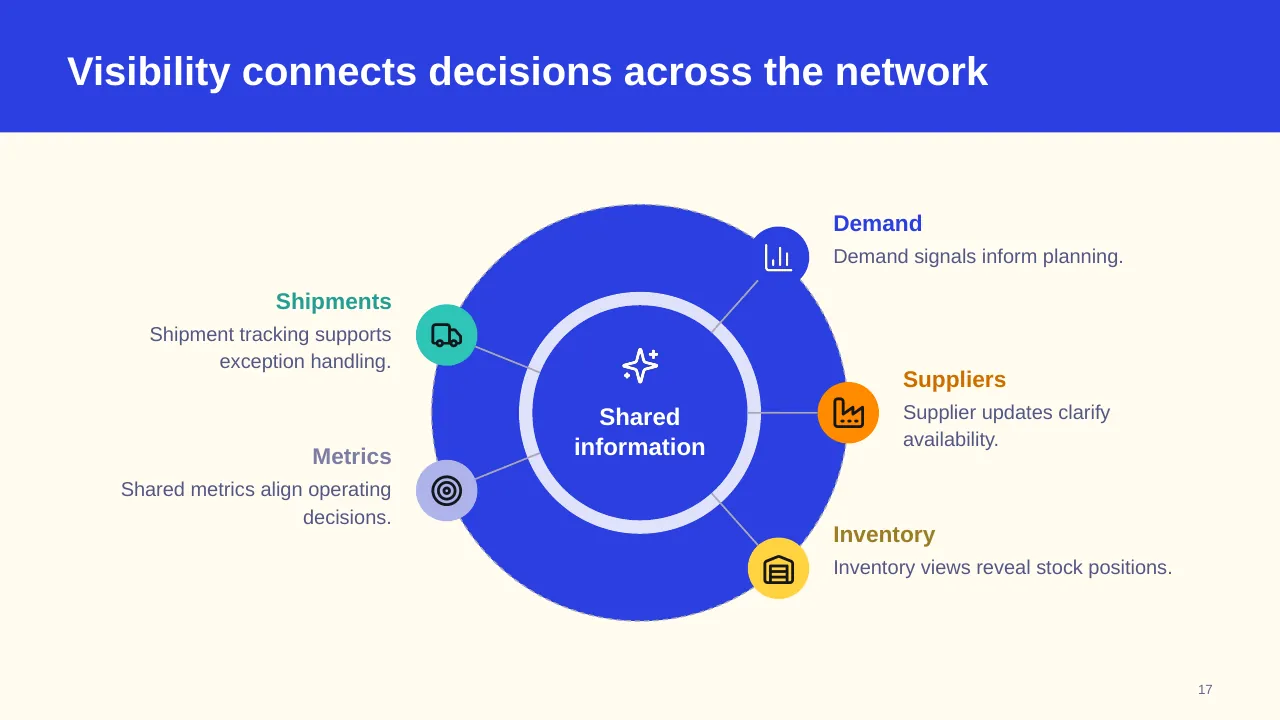
| 17 | Visibility connects decisions across the network |
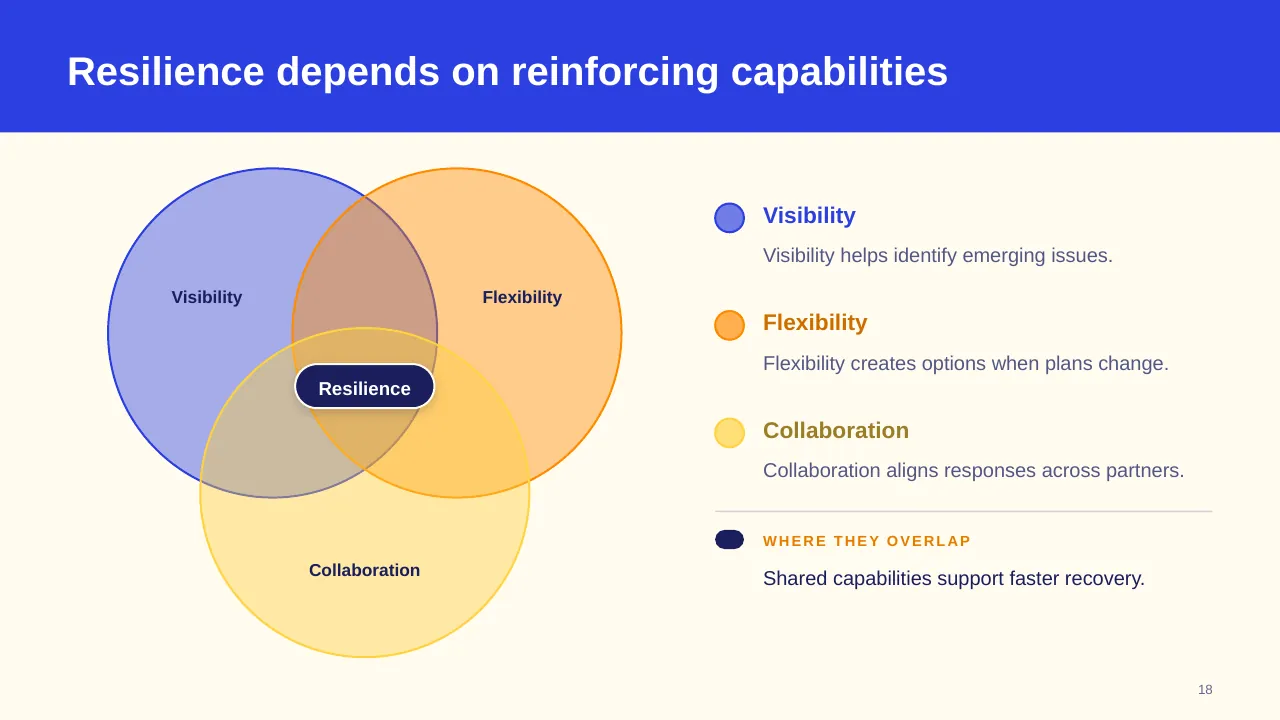
| 18 | Resilience depends on reinforcing capabilities |
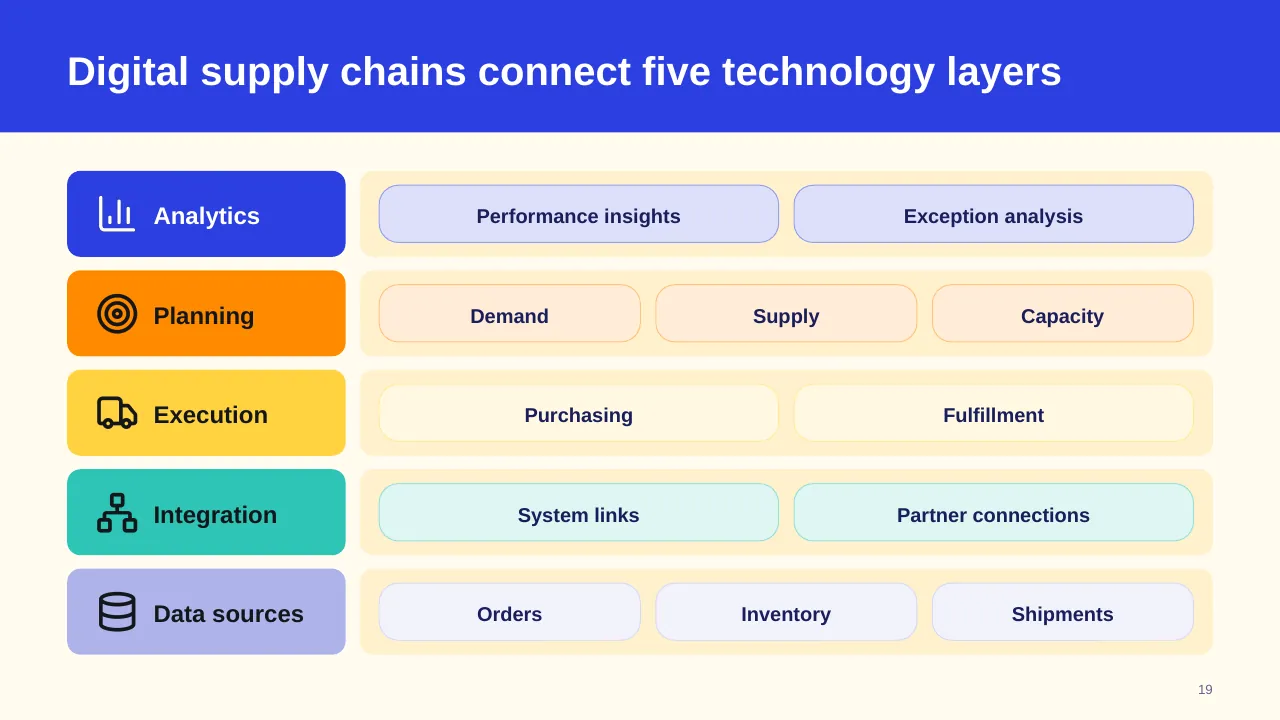
| 19 | Digital supply chains connect five technology layers |
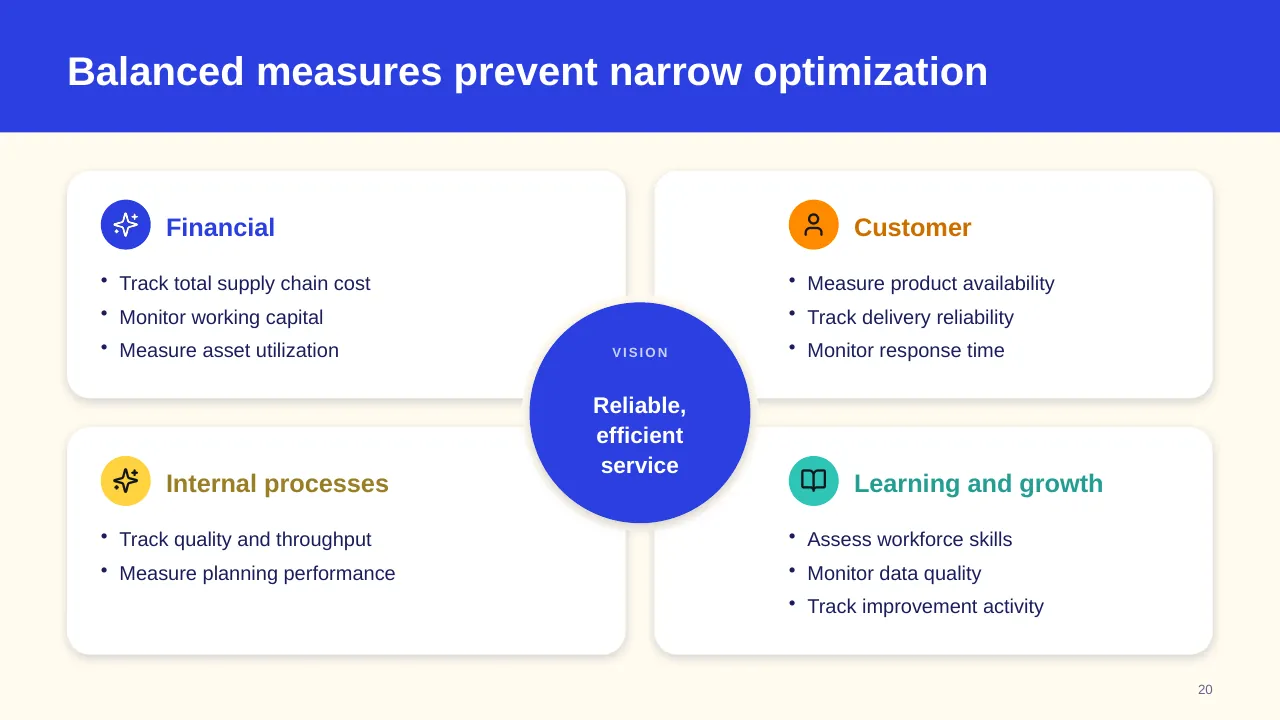
| 20 | Track total supply chain cost Monitor working capital Measure asset utilization |
| 21 | Turn network understanding into a few practical, high-value changes. |
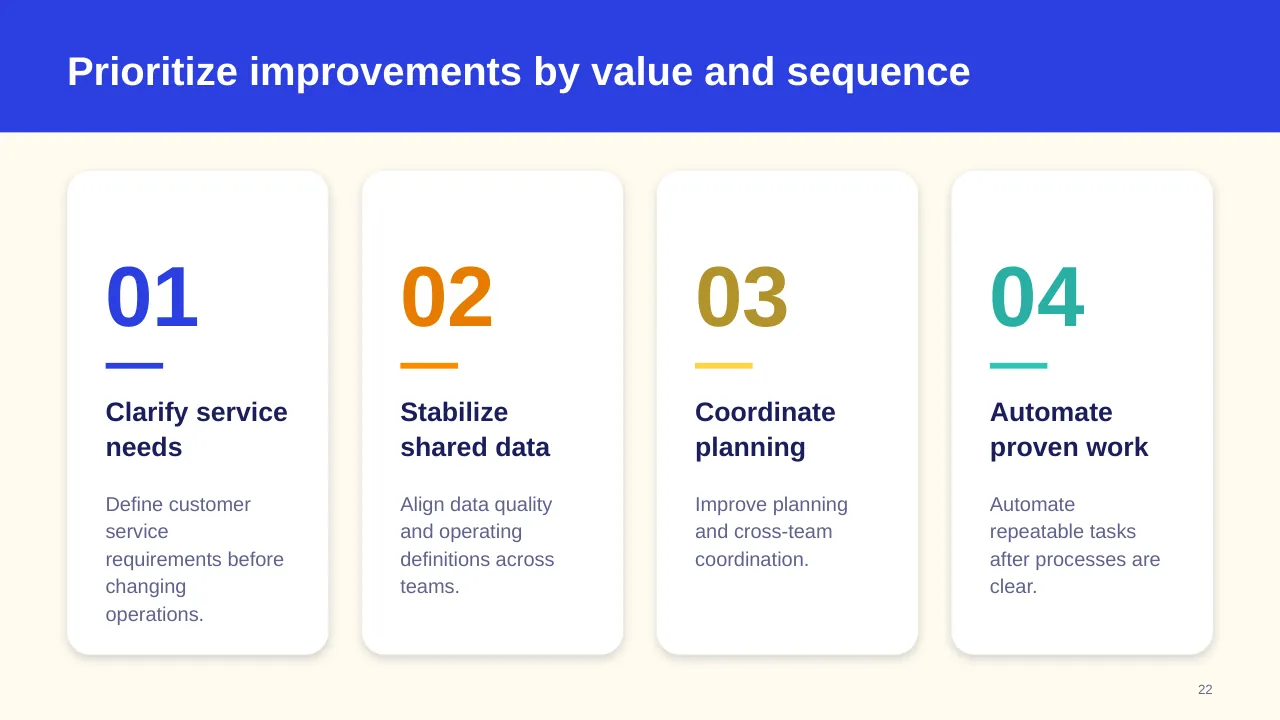
| 22 | Prioritize improvements by value and sequence |
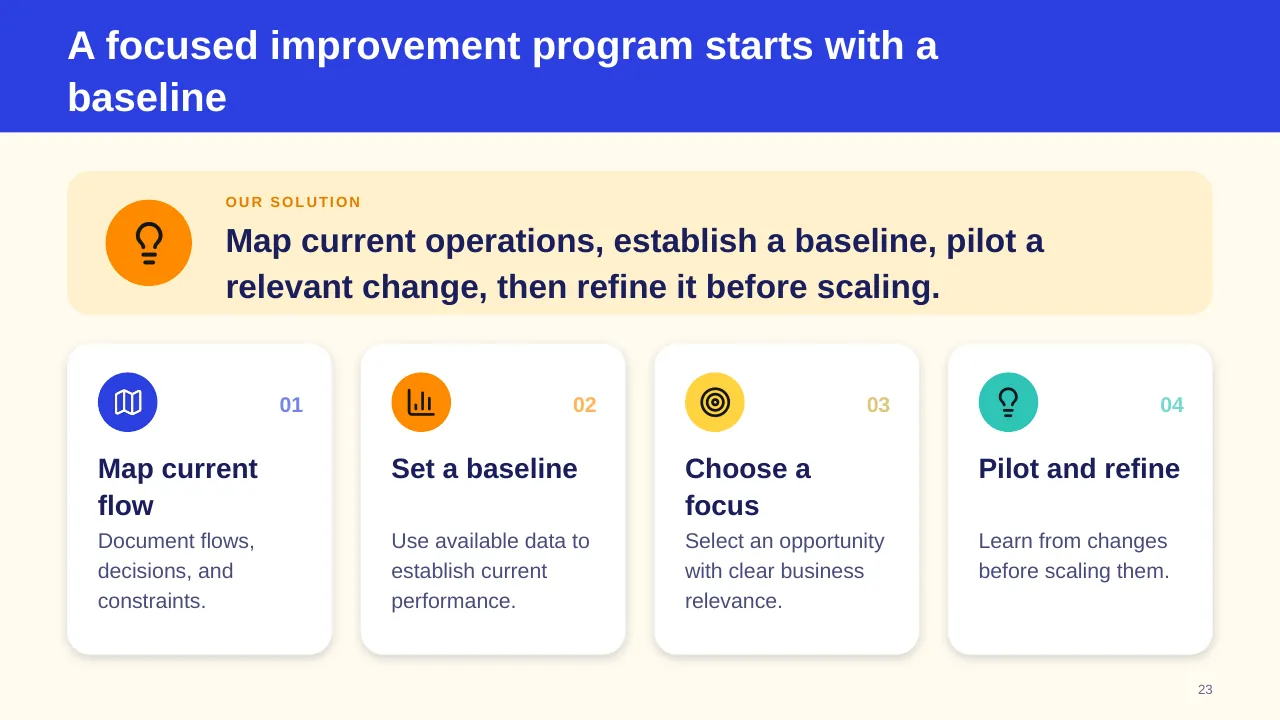
| 23 | Map current operations, establish a baseline, pilot a relevant change, then refine it before scaling. |
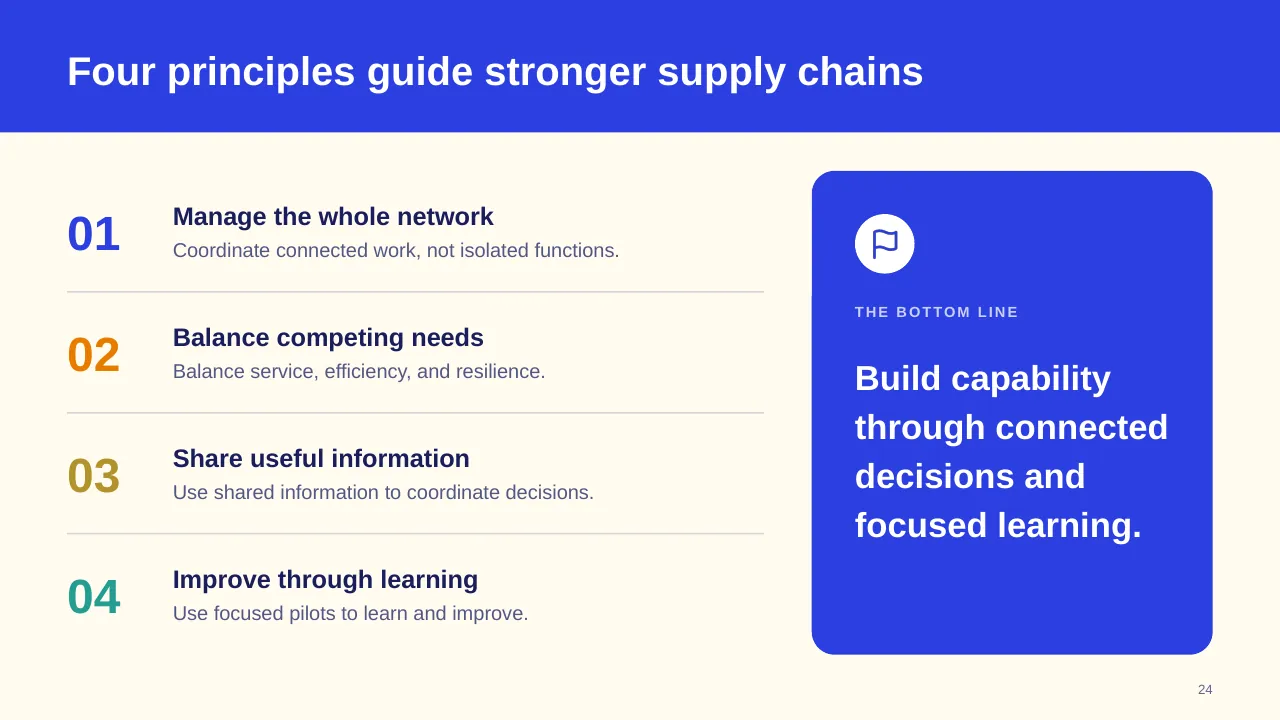
| 24 | Four principles guide stronger supply chains |
| 25 | Choose one network priority, align partners, and turn insight into action. |
Tips for a supply chain presentation
- Size the risk: McKinsey estimates disruptions cost about 45% of a year's profit per decade.
- Show visibility beyond Tier 1 suppliers if you can.
- Balance cost savings with resilience in the same view.
- Use a map or flow diagram for the network.
Mistakes to avoid
- Only cost metrics, no service or risk
- Ignoring sub-tier suppliers
- Plans with no owner
Checklist before you present
- Is the network shown clearly?
- Are cost and service KPIs both included?
- Are critical suppliers identified?
- Are risks prioritised?
- Does each action have an owner?
Great for
- Operations reviews
- Process improvement projects
- Supply chain and logistics planning
- Risk and quality management
How to customise it
- Download the ZIP file and unzip it to get the .pptx presentation.
- Open it in PowerPoint, or upload it to Google Drive and open it with Google Slides.
- Replace the sample text and numbers with your own; charts update from their data sheets.
- Change the theme colours once to recolour the whole deck, then delete any slides you don't need.
Questions about a supply chain presentation
Which supply chain KPIs should I include?
Common ones are on-time in-full (OTIF), inventory turns, lead time, cost to serve and forecast accuracy.
How do I show supply chain risk?
Use a heat map of suppliers or regions by likelihood and impact, and list mitigation actions for the top items.
Related presentations
- Logistics Company Profile PPT Template
- Planning Process in TQM PPT Template
- Operation Readiness Plan PPT Template
- Business Operational Excellence Strategy PPT Template
Browse all Operations & Supply Chain presentations or more business PowerPoint templates.
Template details
| Template | Supply Chain Management PPT Template |
|---|---|
| Categories | Business PowerPoint Templates, Operations & Supply Chain |
| File format | PowerPoint (.pptx), delivered as a .zip file |
| Number of slides | 25 fully editable slides |
| File size | 2.8 MB |
| Slide size | 16:9 widescreen |
| Preview images | 25 |
| Editable | Yes: text, colours, shapes, icons and charts |
| Works with | PowerPoint 2010 and later, PowerPoint for Mac, Google Slides |
| Licence | Royalty-free, yours to keep using after your plan ends (terms of use apply) |
| Price | Included in every SlideVilla plan |
| Added | 30 Nov 2024 |
Questions about this template
Can I edit the Supply Chain Management PPT Template?
Yes. Every part of the Supply Chain Management PPT Template is made with native PowerPoint shapes and text boxes, so you can change the wording, colours, fonts and sizes, move or delete elements, and swap icons without losing quality.
Does the Supply Chain Management PPT Template work in Google Slides?
Yes. Download the .zip file, unzip it to get the .pptx, upload it to Google Drive and open it with Google Slides. The layout, shapes and text stay editable there too.
Is the Supply Chain Management PPT Template free?
It is a premium template, included in every SlideVilla plan together with the rest of the library. See plans and pricing.
What size and format is it?
It is a PPTX file in 16:9 widescreen format with 25 slides, 2.8 MB (downloaded as a .zip; unzip it to get the presentation), with 25 preview images shown above.
How to use this template
- Step 1DownloadClick Download, then unzip the .zip file to get the .pptx presentation.
- Step 2OpenOpen it in PowerPoint, or upload it to Google Slides from your Drive.
- Step 3Make it yoursChange text, colours, icons and charts. Every element is fully editable.
Tags
Related PowerPoint templates
More designs like this one, ready to edit.