Skip to content
    • Log In
    • Register
  • BLOG
  • FAQ
  • ABOUT US
  • CONTACT US
  • PRIVACY POLICY
  • Plans & Pricing
    • Log In
    • Register
SlidevillaSlidevilla

  • Plans & Pricing
  • ALL PRODUCTS
  • Login
  • PowerPoint Templates
    • Agile
    • Business PowerPoint Templates
    • Roadmap
    • Strategy
    • PowerPoint Backgrounds
    • Resume Templates
    • Progressive Roadmap
    • Self Introcution PPT
    • Diversity And Inclusion PPT
    • Roadmap PPT
    • Social Media
    • Kids
    • Idea
    • Health And Fitness
    • Technology
    • Pricing
    • PowerPoint Presentations
    • Slide Deck
  • PowerPoint Diagrams
    • Arrow Diagrams
    • Circular Diagrams
    • Flow Chart Diagrams
    • Funnel Diagrams
    • Process Flow Diagrams
    • Segmented Diagrams
    • Staged Diagrams
  • Power Point Maps
    • Africa
    • Asia
    • South America
    • Central America
    • Europe
    • North America
    • Oceania
    • World Maps & Globes
  • PowerPoint Shapes
    • 3D Shapes for PowerPoint
    • Cartoons
    • Creative
    • Gauges & Meters
    • Recycle
    • Traffic Lights & Signs Gears
  • Data & Charts
    • Bar Chart Presentation
    • Curves and Statistical
    • Pie Charts
    • Dashboards
  • Text & Tables
    • Creative Layouts
    • Comparison PPT Template
    • Comparison Template
  • Login
Home / Shop / PowerPoint Templates
Add to Wishlist

Visualizing Data With Iceberg Graphics PowerPoint Presentation

Download

Category: PowerPoint Templates Tags: Data Analysis Visualization, Data Visualization Techniques, Graphic Communication Skills, Iceberg Infographics Design, PowerPoint presentation tips
Browse
  • Data & Charts
    • Bar Chart Presentation
    • Curves and Statistical
    • Dashboards
    • Pie Charts
  • Free for All
  • Power Point Maps
    • Africa
    • Asia
    • Central America
    • Europe
    • North America
    • Oceania
    • South America
    • World Maps & Globes
  • Power Point Text & Tables
    • Comparison PPT Template
    • Creative Layouts
  • PowerPoint Diagrams
    • Arrow Diagrams
    • Circular Diagrams
    • Flow Chart Diagrams
    • Funnel Diagrams
    • Process Flow Diagrams
    • Segmented Diagrams
    • Staged Diagrams
  • PowerPoint Presentations
  • PowerPoint Shapes
    • 3D Shapes for PowerPoint
    • Cartoons
    • Creative
    • Gauges & Meters
    • Recycle
    • Traffic Lights & Signs Gears
  • PowerPoint Templates
    • Agile
    • Business PowerPoint Templates
    • Health And Fitness
    • Idea
    • Kids
    • PowerPoint Backgrounds
    • Pricing
    • Resume Templates
    • Roadmap
    • Social Media
    • Strategy
    • Technology
  • Slide Deck
  • Description
  • Reviews (0)

**Visualizing Data with Iceberg Graphics PowerPoint Presentation**

Unlock the potential of your data presentations with the Visualizing Data with Iceberg Graphics PowerPoint Presentation. This innovative and visually engaging template is designed to help professionals across all industries depict complex data in a clear and compelling manner. Whether you’re a business analyst, educator, marketer, or consultant, this toolkit is tailored to enhance the way you present your data insights and analysis.

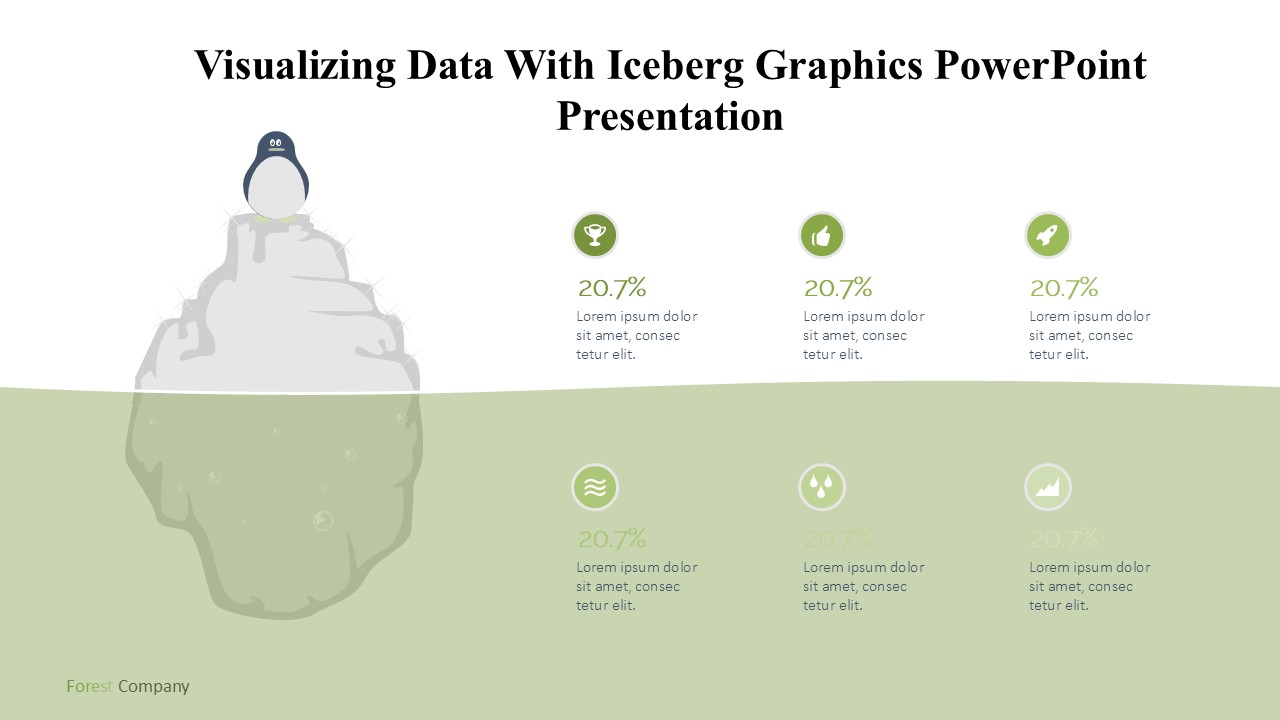
The Visualizing Data with Iceberg Graphics PowerPoint Presentation is not just a set of slides; it’s a comprehensive solution for storytelling with data. The iceberg graphic is a powerful metaphor often used to illustrate the known versus unknown, surface data versus underlying trends, or simple insights against complex backgrounds. With this presentation template, you can leverage this metaphor to structure your information, making your data not only accessible but also memorable.

This presentation package contains a variety of layouts and designs, each fully customizable to suit your specific needs. The main feature is the iceberg illustration, which is creatively used throughout the slides to showcase quantitative and qualitative data. The top of the iceberg can highlight key points, figures, or summaries, while the submerged part can be used to present deeper insights, supporting data, or analysis. This visual arrangement helps in guiding the audience through a logical flow from a high-level overview to in-depth analysis effortlessly.

**Features:**

**1. Fully Editable Templates:** Every slide and element within the Visualizing Data with Iceberg Graphics PowerPoint Presentation is fully editable. This means you can easily change colors, text, fonts, and even the size of graphics without losing quality. Tailor each slide to fit your branding or specific presentation requirements seamlessly.

**2. PowerPoint and Google Slides Compatibility:** This template is designed to be compatible with both PowerPoint and Google Slides. This dual compatibility ensures that you can create, edit, and present using your preferred platform without worrying about file conversions or compatibility issues.

**3. Wide Range of Slides:** The template includes a diverse array of slide types, including title slides, overview slides, detailed analysis slides, and concluding slides. Each type is crafted with the iceberg graphic, which serves as a thematic continuity throughout your presentation.

**4. Easy to Use:** Even if you are not a PowerPoint expert, you will find this template straightforward and user-friendly. The slides are structured in a way that allows you to plug in your data and go. Additionally, it comes with guiding notes to help you make the most out of each slide’s design features.

**5. Versatile Use:** Whether your data is financial, educational, scientific, or business-oriented, the iceberg graphic model lends itself beautifully to a variety of data types and storytelling approaches. It is particularly useful for presentations that require a reveal of layered information or a build-up from basic to complex ideas.

Make your next data presentation not just informative but also impressive with the Visualizing Data with Iceberg Graphics PowerPoint Presentation. It’s more than just a tool; it’s a game-changer for how you communicate data and insights visually.

Reviews

There are no reviews yet.

Be the first to review “Visualizing Data With Iceberg Graphics PowerPoint Presentation” Cancel reply

Best Selling
  • Editable Brazil Map Template for PowerPoint
  • Business process and achievement template Business process and achievement template
    Rated 4.30 out of 5
  • Timeline for sales promotion Powerpoint template Timeline for sales promotion Powerpoint template
    Rated 4.20 out of 5
  • 5 step vertical banner timeline PowerPoint template 5 step vertical banner timeline PowerPoint template
    Rated 4.50 out of 5
Slides
  • Visualizing Data With Iceberg Graphics PowerPoint Presentation
  • World Map Travel PowerPoint Presentation
  • World Map Arrows PowerPoint Presentation
  • Timeline With Phases PowerPoint Presentation
Featured
  • Go to Market Strategy template Go to Market Strategy template
    Rated 4.40 out of 5
    £5.00
  • Business Startup Powerpoint Template Business Startup Powerpoint Template
    Rated 4.43 out of 5
  • 5 Step Creative Cloud Diagram Template 5 Step Creative Cloud Diagram Template
  • Biochemistry slide template ppt Biochemistry slide template ppt
Top Rated
  • Agile Project Management PowerPoint Template Agile Project Management PowerPoint Template
    Rated 5.00 out of 5
  • Escalation Template For PowerPoint Escalation Template For PowerPoint
    Rated 5.00 out of 5
  • Fingertip Electricity Concept PowerPoint Template Fingertip Electricity Concept PowerPoint Template
    Rated 5.00 out of 5
  • Startup Plans and Pricing PowerPoint Template Startup Plans and Pricing PowerPoint Template
    Rated 5.00 out of 5
Our Clinets
COMPANY
  • BLOG
  • FAQ
  • ABOUT US
  • CONTACT US
  • PRIVACY POLICY
Product categories
  • Data & Charts
    • Bar Chart Presentation
    • Curves and Statistical
    • Dashboards
    • Pie Charts
  • Free for All
  • Power Point Maps
    • Africa
    • Asia
    • Central America
    • Europe
    • North America
    • Oceania
    • South America
    • World Maps & Globes
  • Power Point Text & Tables
    • Comparison PPT Template
    • Creative Layouts
  • PowerPoint Diagrams
    • Arrow Diagrams
    • Circular Diagrams
    • Flow Chart Diagrams
    • Funnel Diagrams
    • Process Flow Diagrams
    • Segmented Diagrams
    • Staged Diagrams
  • PowerPoint Presentations
  • PowerPoint Shapes
    • 3D Shapes for PowerPoint
    • Cartoons
    • Creative
    • Gauges & Meters
    • Recycle
    • Traffic Lights & Signs Gears
  • PowerPoint Templates
    • Agile
    • Business PowerPoint Templates
    • Health And Fitness
    • Idea
    • Kids
    • PowerPoint Backgrounds
    • Pricing
    • Resume Templates
    • Roadmap
    • Social Media
    • Strategy
    • Technology
  • Slide Deck
Recent Posts
  • Best Acknowledgment Samples and examples
  • 23
    Jul
    Você sabe que a roda de cores simples pode chamar a atenção?
  • Do you know the simple color wheel can catch the eye?
Copyright 2025 © SlideVilla.Com
  • Login
  • Sign Up
Forgot Password?
Lost your password? Please enter your username or email address. You will receive a link to create a new password via email.
Connect with:
Google

Login

Lost your password?

Register

Your personal data will be used to support your experience throughout this website, to manage access to your account, and for other purposes described in our privacy policy.