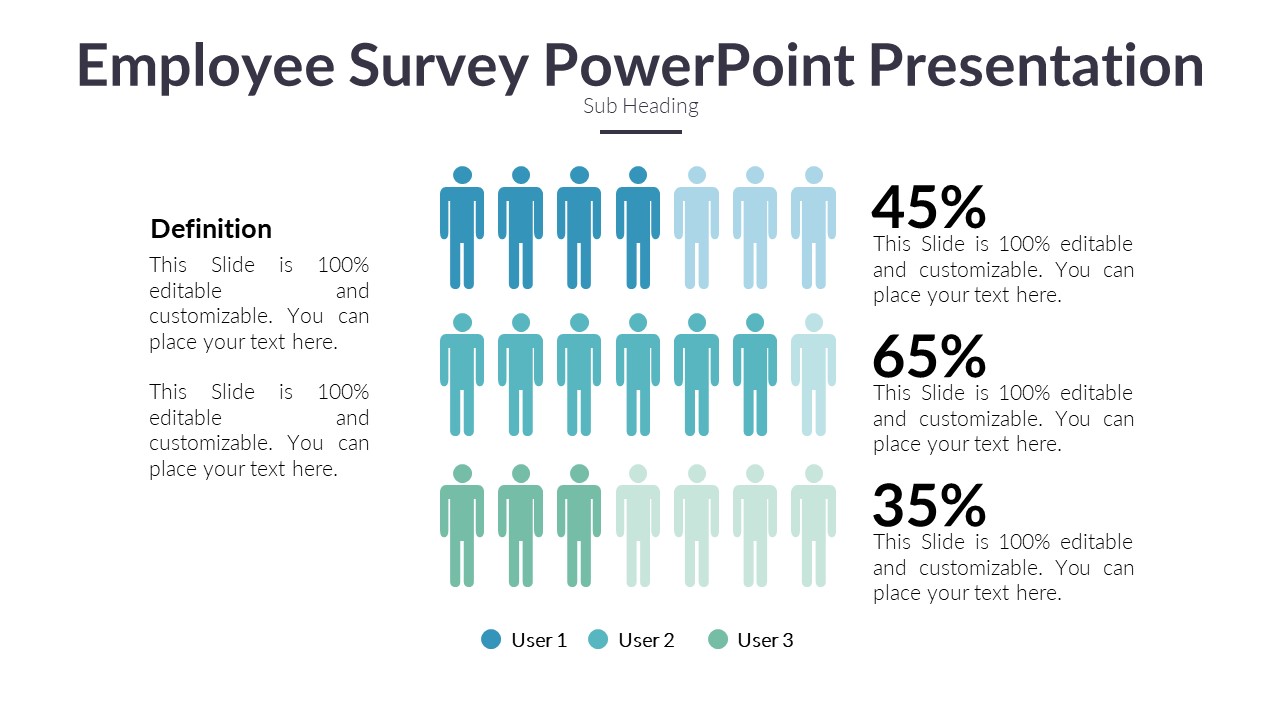
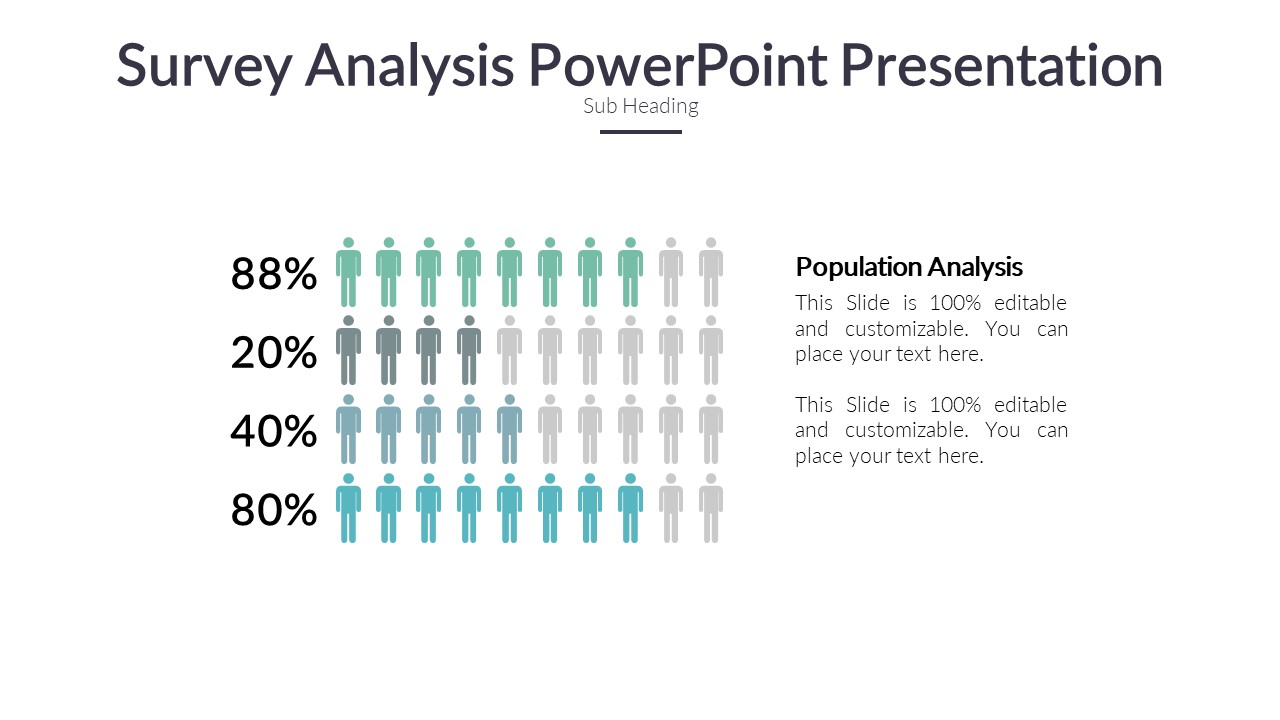
The Survey Analysis PowerPoint Presentation is a comprehensive and professional way to present your survey findings to team members, clients, or stakeholders. This fully editable template allows you to showcase your survey results in a clear and visually appealing manner, helping you communicate your data effectively.
With this PowerPoint presentation, you can easily input your survey data, analyze the results, and create visual representations such as graphs, charts, and tables. The template includes slides for displaying key statistics, trends, insights, and recommendations derived from your survey analysis. You can customize the colors, fonts, and layouts to suit your branding or preferences, ensuring a polished and cohesive presentation.
Key Features:
1. Fully Editable Slides: Easily customize the content, layout, and design of each slide to match your specific survey data and presentation needs.
2. Data Visualization Tools: Utilize a variety of charts, graphs, and tables to display your survey results in a visually appealing and easy-to-understand format.
3. Statistical Analysis: Present key statistics and insights from your survey findings to convey important information effectively.
4. Recommendations Section: Include slides for sharing recommendations based on the survey analysis to guide decision-making and action planning.
5. Branding Options: Personalize the template with your company logo, colors, and fonts to maintain consistency with your branding guidelines.
Overall, the Survey Analysis PowerPoint Presentation template is a valuable tool for any professional looking to communicate survey results clearly and persuasively. Whether you’re conducting customer satisfaction surveys, market research, or employee feedback surveys, this template will help you create a compelling presentation that highlights the most important findings and drives meaningful discussions.


Be the first to review “Survey Analysis PowerPoint Presentation”