
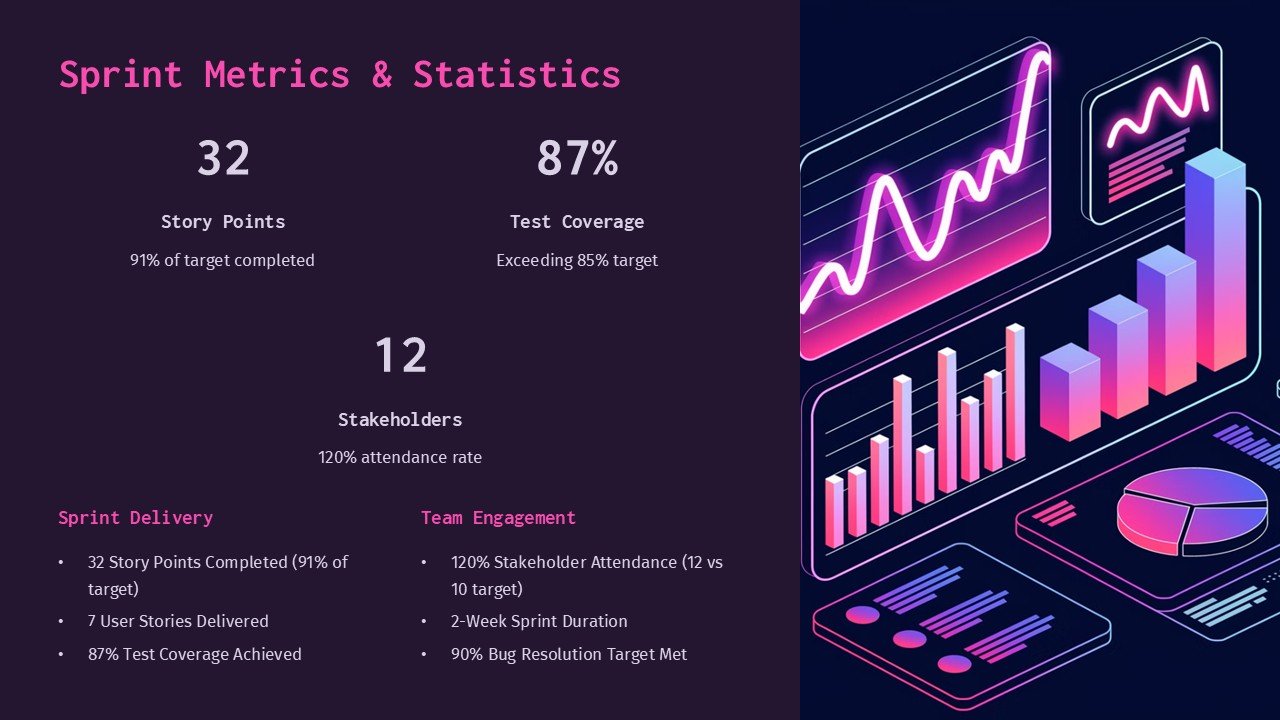
Sprint Metrics & Statistics PowerPoint Presentation is a powerful and versatile tool designed to help businesses showcase and analyze their sprint performance effectively. This professionally designed template offers a range of visually appealing slides that allow users to present key metrics, statistics, and performance data in a clear and engaging manner.
With the Sprint Metrics & Statistics PowerPoint Presentation, users can easily highlight important KPIs, track progress over time, compare different sprints, and identify trends and patterns in their sprint performance. The template includes a variety of slide layouts, including charts, graphs, tables, and diagrams, that can be customized to suit specific needs and requirements.
Features of Sprint Metrics & Statistics PowerPoint Presentation include:
– Fully editable slides: Easily customize the content, colors, fonts, and layout to create a professional and unique presentation.
– Data visualization tools: Present complex data in an easy-to-understand format with a variety of charts and graphs.
– Infographic elements: Use visual aids such as icons, diagrams, and illustrations to enhance the message and engage the audience.
– Ready-made templates: Save time and effort with pre-designed slides that can be easily tailored to suit individual preferences.
Overall, Sprint Metrics & Statistics PowerPoint Presentation is an essential tool for businesses looking to track and analyze their sprint performance effectively. Whether you are presenting to stakeholders, team members, or clients, this template will help you communicate key metrics and statistics with clarity and impact.

Be the first to review “Sprint Metrics & Statistics PowerPoint Presentation”