Skip to content
    • Log In
    • Register
  • BLOG
  • FAQ
  • ABOUT US
  • CONTACT US
  • PRIVACY POLICY
  • Plans & Pricing
    • Log In
    • Register
SlidevillaSlidevilla

  • Plans & Pricing
  • ALL PRODUCTS
  • Login
  • PowerPoint Templates
    • Agile
    • Business PowerPoint Templates
    • Roadmap
    • Strategy
    • PowerPoint Backgrounds
    • Resume Templates
    • Progressive Roadmap
    • Self Introcution PPT
    • Diversity And Inclusion PPT
    • Roadmap PPT
    • Social Media
    • Kids
    • Idea
    • Health And Fitness
    • Technology
    • Pricing
    • PowerPoint Presentations
    • Slide Deck
  • PowerPoint Diagrams
    • Arrow Diagrams
    • Circular Diagrams
    • Flow Chart Diagrams
    • Funnel Diagrams
    • Process Flow Diagrams
    • Segmented Diagrams
    • Staged Diagrams
  • Power Point Maps
    • Africa
    • Asia
    • South America
    • Central America
    • Europe
    • North America
    • Oceania
    • World Maps & Globes
  • PowerPoint Shapes
    • 3D Shapes for PowerPoint
    • Cartoons
    • Creative
    • Gauges & Meters
    • Recycle
    • Traffic Lights & Signs Gears
  • Data & Charts
    • Bar Chart Presentation
    • Curves and Statistical
    • Pie Charts
    • Dashboards
  • Text & Tables
    • Creative Layouts
    • Comparison PPT Template
    • Comparison Template
  • Login
Home / Shop / PowerPoint Presentations
Add to Wishlist

Rolling 12 Month Quality Trends PowerPoint Presentation

Download

Category: PowerPoint Presentations
Browse
  • Data & Charts
    • Bar Chart Presentation
    • Curves and Statistical
    • Dashboards
    • Pie Charts
  • Free for All
  • Power Point Maps
    • Africa
    • Asia
    • Central America
    • Europe
    • North America
    • Oceania
    • South America
    • World Maps & Globes
  • Power Point Text & Tables
    • Comparison PPT Template
    • Creative Layouts
  • PowerPoint Diagrams
    • Arrow Diagrams
    • Circular Diagrams
    • Flow Chart Diagrams
    • Funnel Diagrams
    • Process Flow Diagrams
    • Segmented Diagrams
    • Staged Diagrams
  • PowerPoint Presentations
  • PowerPoint Shapes
    • 3D Shapes for PowerPoint
    • Cartoons
    • Creative
    • Gauges & Meters
    • Recycle
    • Traffic Lights & Signs Gears
  • PowerPoint Templates
    • Agile
    • Business PowerPoint Templates
    • Health And Fitness
    • Idea
    • Kids
    • PowerPoint Backgrounds
    • Pricing
    • Resume Templates
    • Roadmap
    • Social Media
    • Strategy
    • Technology
  • Slide Deck
  • Description
  • Reviews (0)

The Rolling 12 Month Quality Trends PowerPoint Presentation is a powerful tool designed to help businesses analyze and track quality trends over a period of time. This presentation template is ideal for quality control managers, project managers, and business owners who need to visualize and communicate quality data effectively.

This PowerPoint presentation features a clean and professional design, with a focus on clarity and ease of use. The template includes a set of slides that allows users to display various quality metrics, such as defect rates, customer satisfaction scores, and process improvement initiatives. Users can easily customize the slides to suit their specific needs, by adding their own data, charts, and images.

One of the key features of the Rolling 12 Month Quality Trends PowerPoint Presentation is its fully editable templates. Users can easily modify the content, colors, and layout of each slide to create a customized presentation that meets their unique requirements. This flexibility makes it easy to tailor the presentation to different audiences or to highlight specific trends or insights.

In addition to its editable templates, this PowerPoint presentation also includes a range of useful features, such as:

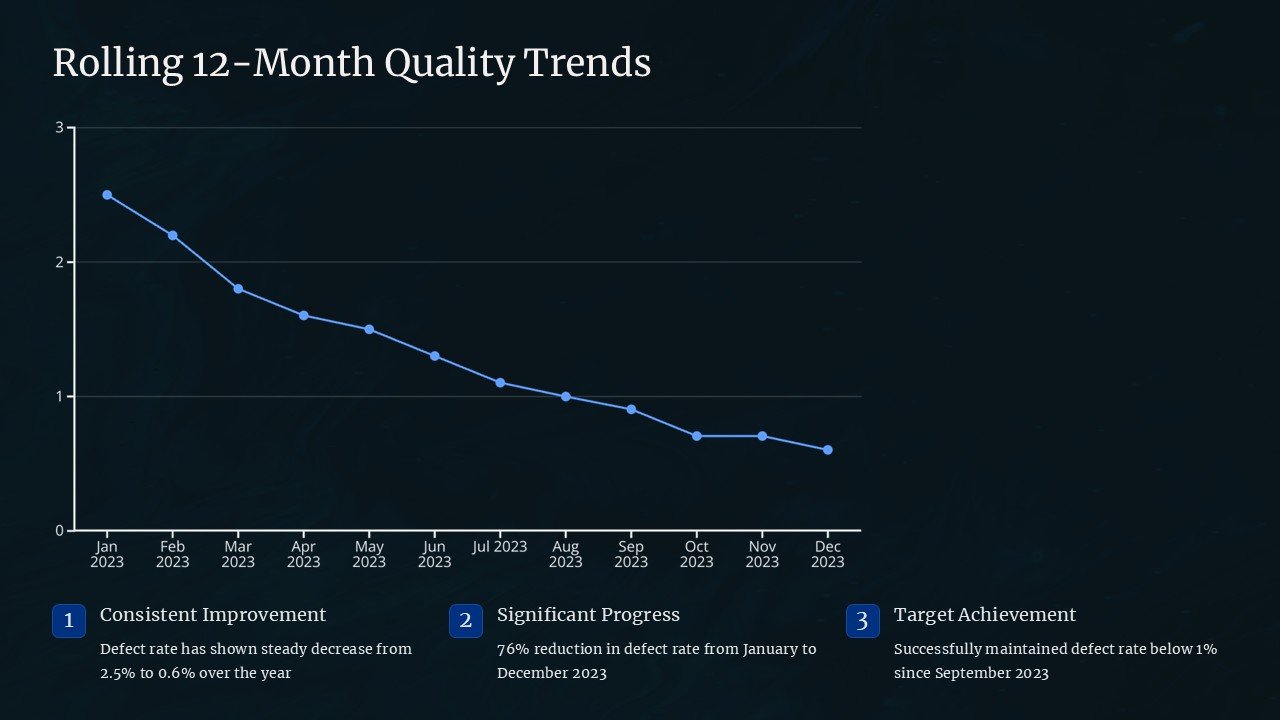
– Data-driven charts and graphs that can be easily updated with new information.
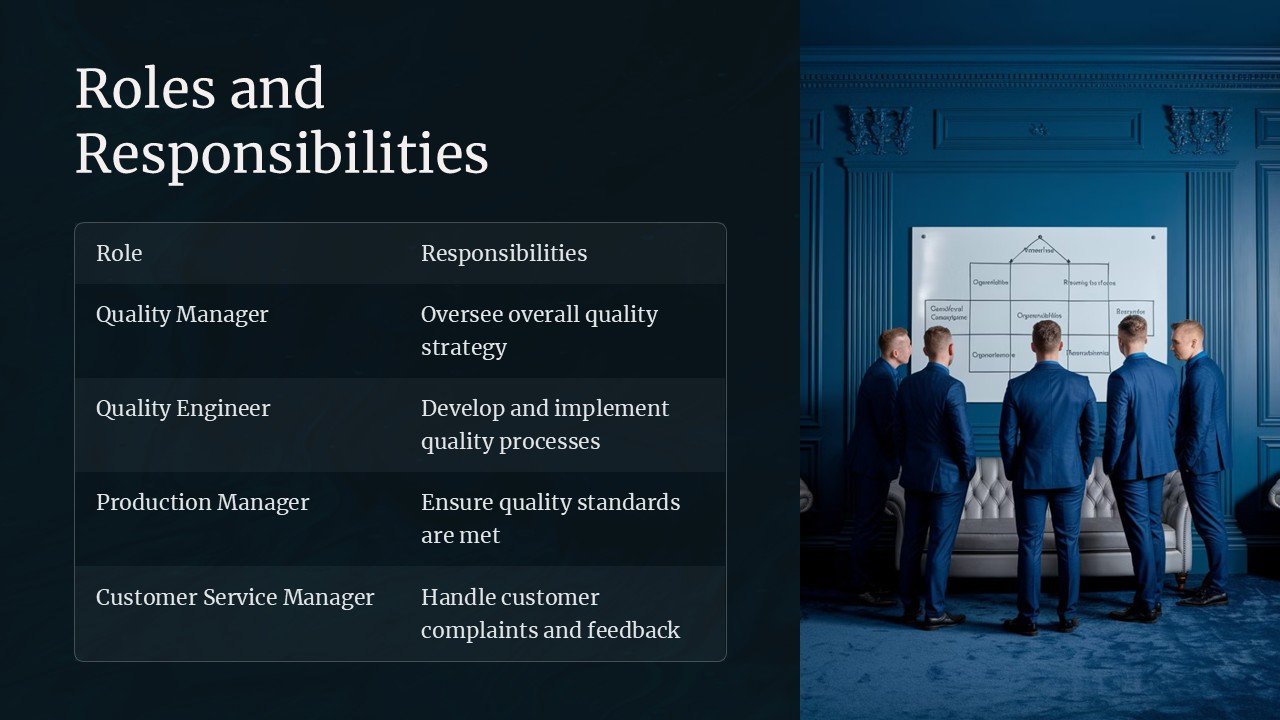
– Icons and symbols to help illustrate key points and trends.
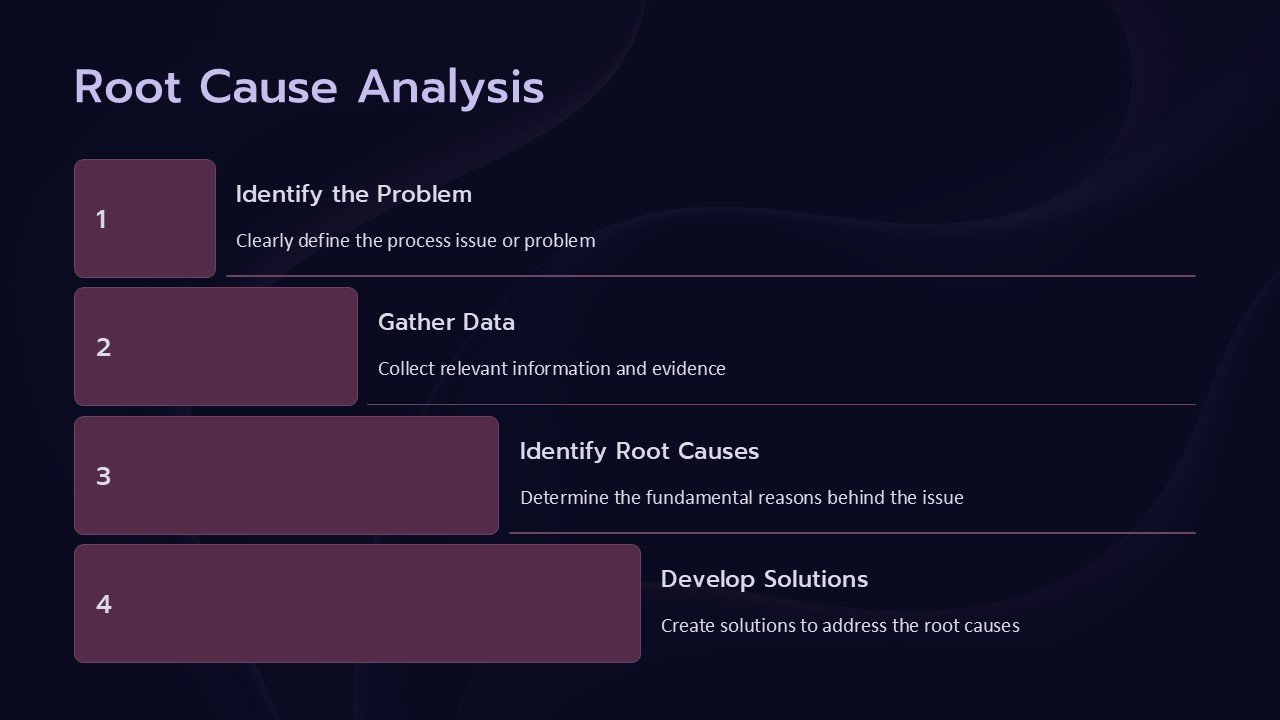
– Well-organized slides with a logical flow that guides users through the quality data analysis process.
– Clear and concise text placeholders for adding descriptions, notes, or additional context to the slides.

Overall, the Rolling 12 Month Quality Trends PowerPoint Presentation is a valuable tool for businesses looking to track and communicate quality trends effectively. Its user-friendly design, fully editable templates, and range of features make it a versatile solution for anyone working in quality control or process improvement.

Reviews

There are no reviews yet.

Be the first to review “Rolling 12 Month Quality Trends PowerPoint Presentation” Cancel reply

Best Selling
  • Editable Brazil Map Template for PowerPoint
  • Business process and achievement template Business process and achievement template
    Rated 4.30 out of 5
  • Timeline for sales promotion Powerpoint template Timeline for sales promotion Powerpoint template
    Rated 4.20 out of 5
  • 5 step vertical banner timeline PowerPoint template 5 step vertical banner timeline PowerPoint template
    Rated 4.50 out of 5
Slides
  • Visualizing Data With Iceberg Graphics PowerPoint Presentation
  • World Map Travel PowerPoint Presentation
  • World Map Arrows PowerPoint Presentation
  • Timeline With Phases PowerPoint Presentation
Featured
  • Go to Market Strategy template Go to Market Strategy template
    Rated 4.40 out of 5
    £5.00
  • Business Action Plan Power Point Template Business Action Plan Power Point Template
    Rated 4.60 out of 5
  • Funnel Diagram template Funnel Diagram template
    Rated 4.79 out of 5
  • Ladder Infographic template Ladder Infographic template
    Rated 5.00 out of 5
Top Rated
  • Agile Project Management PowerPoint Template Agile Project Management PowerPoint Template
    Rated 5.00 out of 5
  • Escalation Template For PowerPoint Escalation Template For PowerPoint
    Rated 5.00 out of 5
  • Fingertip Electricity Concept PowerPoint Template Fingertip Electricity Concept PowerPoint Template
    Rated 5.00 out of 5
  • Startup Plans and Pricing PowerPoint Template Startup Plans and Pricing PowerPoint Template
    Rated 5.00 out of 5
Our Clinets
COMPANY
  • BLOG
  • FAQ
  • ABOUT US
  • CONTACT US
  • PRIVACY POLICY
Product categories
  • Data & Charts
    • Bar Chart Presentation
    • Curves and Statistical
    • Dashboards
    • Pie Charts
  • Free for All
  • Power Point Maps
    • Africa
    • Asia
    • Central America
    • Europe
    • North America
    • Oceania
    • South America
    • World Maps & Globes
  • Power Point Text & Tables
    • Comparison PPT Template
    • Creative Layouts
  • PowerPoint Diagrams
    • Arrow Diagrams
    • Circular Diagrams
    • Flow Chart Diagrams
    • Funnel Diagrams
    • Process Flow Diagrams
    • Segmented Diagrams
    • Staged Diagrams
  • PowerPoint Presentations
  • PowerPoint Shapes
    • 3D Shapes for PowerPoint
    • Cartoons
    • Creative
    • Gauges & Meters
    • Recycle
    • Traffic Lights & Signs Gears
  • PowerPoint Templates
    • Agile
    • Business PowerPoint Templates
    • Health And Fitness
    • Idea
    • Kids
    • PowerPoint Backgrounds
    • Pricing
    • Resume Templates
    • Roadmap
    • Social Media
    • Strategy
    • Technology
  • Slide Deck
Recent Posts
  • Best Acknowledgment Samples and examples
  • 23
    Jul
    Você sabe que a roda de cores simples pode chamar a atenção?
  • Do you know the simple color wheel can catch the eye?
Copyright 2025 © SlideVilla.Com
  • Login
  • Sign Up
Forgot Password?
Lost your password? Please enter your username or email address. You will receive a link to create a new password via email.
Connect with:
Google

Login

Lost your password?

Register

Your personal data will be used to support your experience throughout this website, to manage access to your account, and for other purposes described in our privacy policy.