Skip to content
    • Log In
    • Register
  • BLOG
  • FAQ
  • ABOUT US
  • CONTACT US
  • PRIVACY POLICY
  • Plans & Pricing
    • Log In
    • Register
SlidevillaSlidevilla

  • Plans & Pricing
  • ALL PRODUCTS
  • Login
  • PowerPoint Templates
    • Agile
    • Business PowerPoint Templates
    • Roadmap
    • Strategy
    • PowerPoint Backgrounds
    • Resume Templates
    • Progressive Roadmap
    • Self Introcution PPT
    • Diversity And Inclusion PPT
    • Roadmap PPT
    • Social Media
    • Kids
    • Idea
    • Health And Fitness
    • Technology
    • Pricing
    • PowerPoint Presentations
    • Slide Deck
  • PowerPoint Diagrams
    • Arrow Diagrams
    • Circular Diagrams
    • Flow Chart Diagrams
    • Funnel Diagrams
    • Process Flow Diagrams
    • Segmented Diagrams
    • Staged Diagrams
  • Power Point Maps
    • Africa
    • Asia
    • South America
    • Central America
    • Europe
    • North America
    • Oceania
    • World Maps & Globes
  • PowerPoint Shapes
    • 3D Shapes for PowerPoint
    • Cartoons
    • Creative
    • Gauges & Meters
    • Recycle
    • Traffic Lights & Signs Gears
  • Data & Charts
    • Bar Chart Presentation
    • Curves and Statistical
    • Pie Charts
    • Dashboards
  • Text & Tables
    • Creative Layouts
    • Comparison PPT Template
    • Comparison Template
  • Login
Home / Shop / PowerPoint Templates
Add to Wishlist

Kpi Dashboard Powerpoint Presentation

Download

Category: PowerPoint Templates
Browse
  • Data & Charts
    • Bar Chart Presentation
    • Curves and Statistical
    • Dashboards
    • Pie Charts
  • Free for All
  • Power Point Maps
    • Africa
    • Asia
    • Central America
    • Europe
    • North America
    • Oceania
    • South America
    • World Maps & Globes
  • Power Point Text & Tables
    • Comparison PPT Template
    • Creative Layouts
  • PowerPoint Diagrams
    • Arrow Diagrams
    • Circular Diagrams
    • Flow Chart Diagrams
    • Funnel Diagrams
    • Process Flow Diagrams
    • Segmented Diagrams
    • Staged Diagrams
  • PowerPoint Presentations
  • PowerPoint Shapes
    • 3D Shapes for PowerPoint
    • Cartoons
    • Creative
    • Gauges & Meters
    • Recycle
    • Traffic Lights & Signs Gears
  • PowerPoint Templates
    • Agile
    • Business PowerPoint Templates
    • Health And Fitness
    • Idea
    • Kids
    • PowerPoint Backgrounds
    • Pricing
    • Resume Templates
    • Roadmap
    • Social Media
    • Strategy
    • Technology
  • Slide Deck
  • Description
  • Reviews (0)

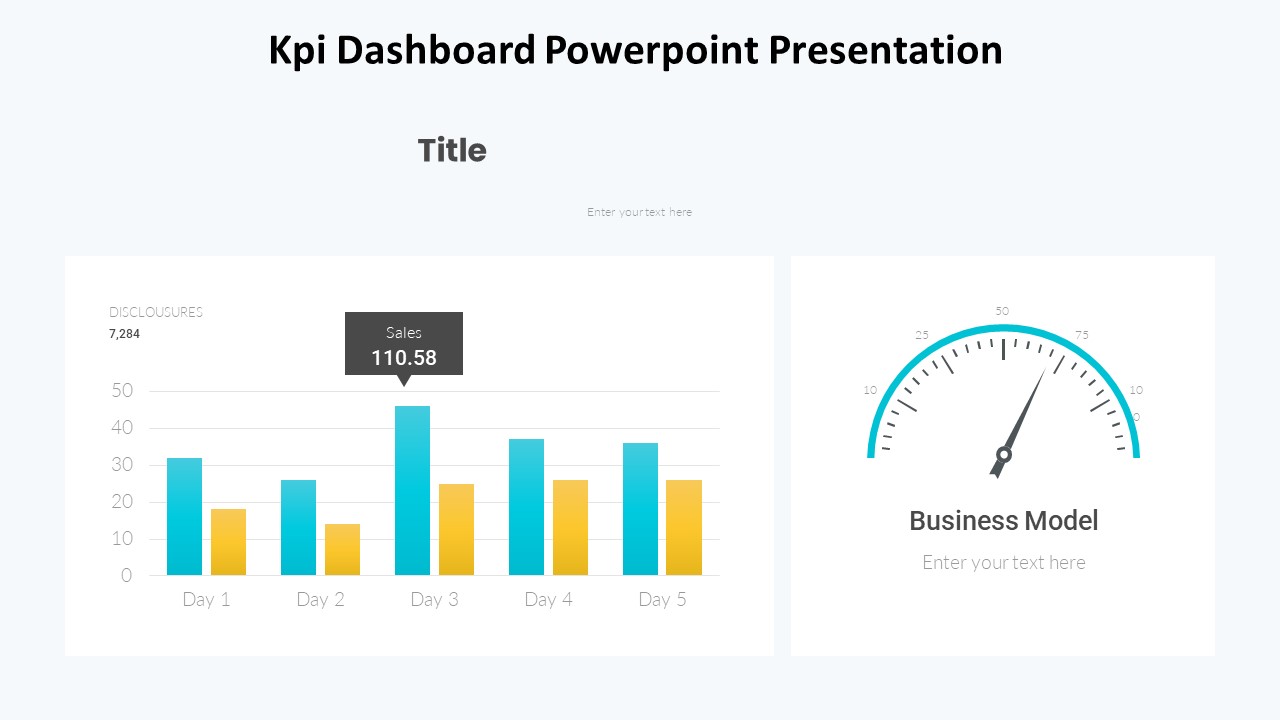
The KPI Dashboard PowerPoint Presentation is a powerful tool for businesses looking to track and analyze their key performance indicators in a visually appealing and easy-to-understand format. This professionally designed template allows users to effectively communicate complex data and metrics to stakeholders, team members, and decision-makers.

Featuring a clean and modern design, the KPI Dashboard PowerPoint Presentation includes a variety of slide layouts that can be customized to suit individual needs. With a user-friendly interface and fully editable elements, users can easily add, remove, or modify data points, charts, graphs, and tables to create a customized dashboard that meets their specific requirements.

Key features of the KPI Dashboard PowerPoint Presentation include:

1. Fully editable templates: Easily customize the color scheme, fonts, layout, and content to match your brand guidelines and preferences.

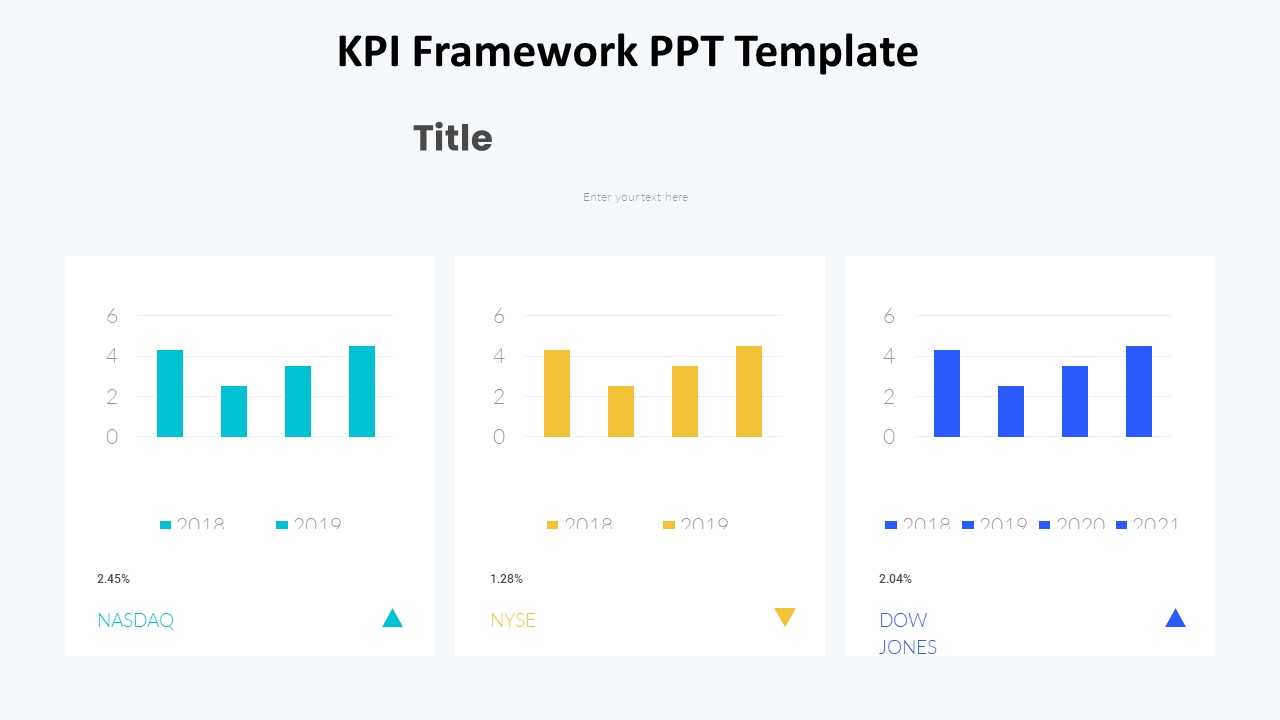
2. Data visualization tools: Present complex data and metrics in a clear and concise manner using charts, graphs, and tables.

3. Interactive elements: Add interactive elements such as clickable buttons, hyperlinks, and animations to engage your audience and make your presentation more dynamic.

4. Easy data input: Input data directly into the dashboard using Excel or other data sources for seamless integration and updates.

5. Multiple slide layouts: Choose from a variety of slide layouts including summary slides, comparison slides, trend analysis slides, and more to effectively communicate your KPIs.

Overall, the KPI Dashboard PowerPoint Presentation is a versatile and user-friendly tool that can help businesses track, analyze, and communicate key performance indicators with ease. Whether you’re presenting to internal teams, clients, or stakeholders, this template is sure to impress with its professional design and customizable features.

Reviews

There are no reviews yet.

Be the first to review “Kpi Dashboard Powerpoint Presentation” Cancel reply

Best Selling
  • Editable Brazil Map Template for PowerPoint
  • 3D Bar Chart Growth for PowerPoint Template
  • Business Marketing Trends PowerPoint Template
  • Survey Recycle for PowerPoint Template Survey Recycle for PowerPoint Template
Slides
  • Visualizing Data With Iceberg Graphics PowerPoint Presentation
  • World Map Travel PowerPoint Presentation
  • World Map Arrows PowerPoint Presentation
  • Timeline With Phases PowerPoint Presentation
Featured
  • Go to Market Strategy template Go to Market Strategy template
    Rated 4.40 out of 5
    £5.00
  • Business Startup Powerpoint Template Business Startup Powerpoint Template
    Rated 4.43 out of 5
  • 5 Step Creative Cloud Diagram Template 5 Step Creative Cloud Diagram Template
  • Biochemistry slide template ppt Biochemistry slide template ppt
Top Rated
  • Agile Project Management PowerPoint Template Agile Project Management PowerPoint Template
    Rated 5.00 out of 5
  • Fingertip Electricity Concept PowerPoint Template Fingertip Electricity Concept PowerPoint Template
    Rated 5.00 out of 5
  • Startup Plans and Pricing PowerPoint Template Startup Plans and Pricing PowerPoint Template
    Rated 5.00 out of 5
  • Escalation Template For PowerPoint Escalation Template For PowerPoint
    Rated 5.00 out of 5
Our Clinets
COMPANY
  • BLOG
  • FAQ
  • ABOUT US
  • CONTACT US
  • PRIVACY POLICY
Product categories
  • Data & Charts
    • Bar Chart Presentation
    • Curves and Statistical
    • Dashboards
    • Pie Charts
  • Free for All
  • Power Point Maps
    • Africa
    • Asia
    • Central America
    • Europe
    • North America
    • Oceania
    • South America
    • World Maps & Globes
  • Power Point Text & Tables
    • Comparison PPT Template
    • Creative Layouts
  • PowerPoint Diagrams
    • Arrow Diagrams
    • Circular Diagrams
    • Flow Chart Diagrams
    • Funnel Diagrams
    • Process Flow Diagrams
    • Segmented Diagrams
    • Staged Diagrams
  • PowerPoint Presentations
  • PowerPoint Shapes
    • 3D Shapes for PowerPoint
    • Cartoons
    • Creative
    • Gauges & Meters
    • Recycle
    • Traffic Lights & Signs Gears
  • PowerPoint Templates
    • Agile
    • Business PowerPoint Templates
    • Health And Fitness
    • Idea
    • Kids
    • PowerPoint Backgrounds
    • Pricing
    • Resume Templates
    • Roadmap
    • Social Media
    • Strategy
    • Technology
  • Slide Deck
Recent Posts
  • Best Acknowledgment Samples and examples
  • 23
    Jul
    Você sabe que a roda de cores simples pode chamar a atenção?
  • Do you know the simple color wheel can catch the eye?
Copyright 2025 © SlideVilla.Com
  • Login
  • Sign Up
Forgot Password?
Lost your password? Please enter your username or email address. You will receive a link to create a new password via email.
Connect with:
Google

Login

Lost your password?

Register

Your personal data will be used to support your experience throughout this website, to manage access to your account, and for other purposes described in our privacy policy.