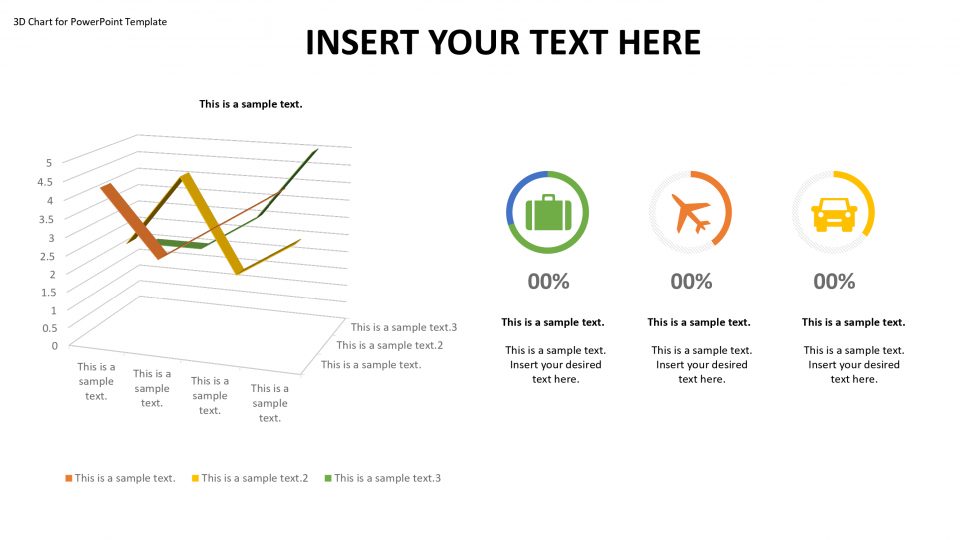
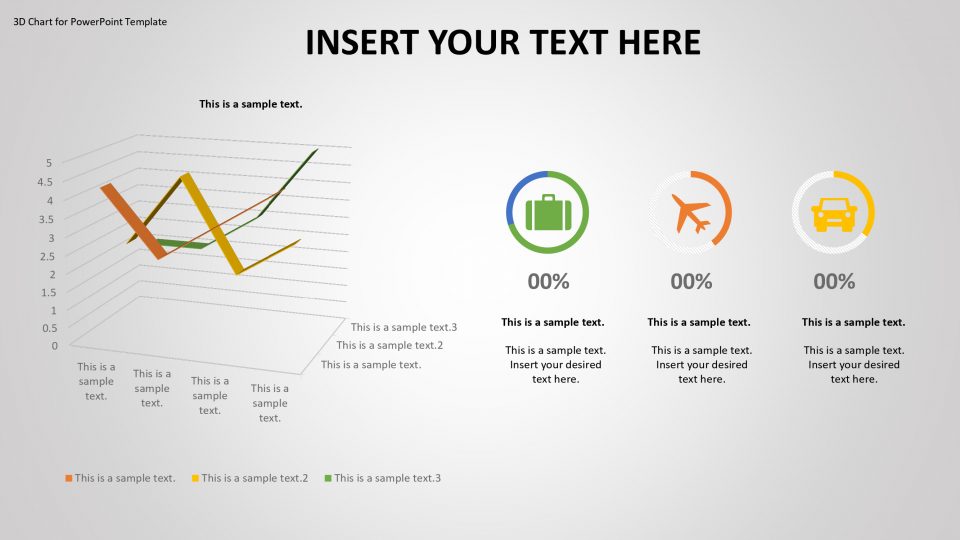
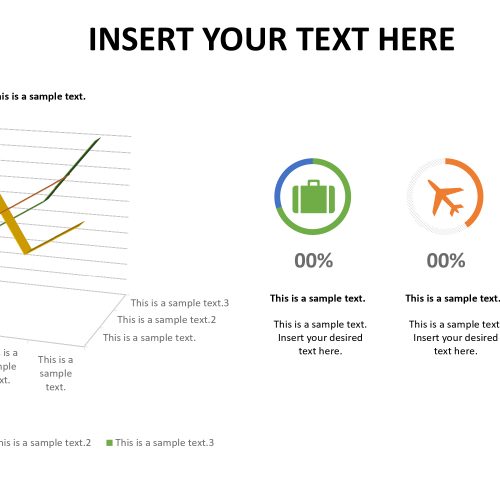
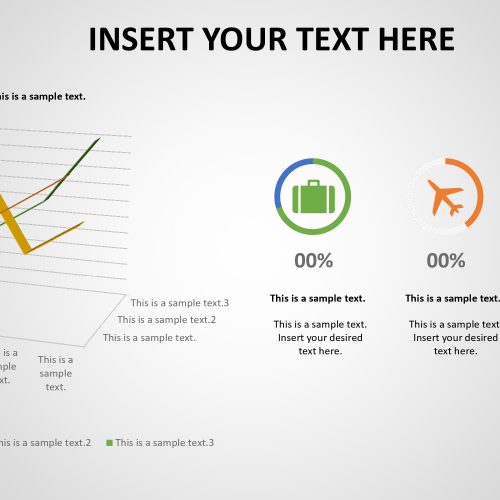
The 3D chart powerpoint template is a business analysis and progress report design. This template is used by organizations and companies to show progress of different specific goals, idea.
These business goals, objectives are represented using icons that can be edited in powerpoint to represent them, and the progress of these goals are presented in a table. The icons are color specific, so the progress chart has color specific lines that represent what each is representing. The lines have no specific shape, and are inter-laying over one another, and they are differentiated by their colors, and they shows progress or no progress in a graph. The template is colorful, easy to understand if the user represents the information and data well, and the icons are modifiable.
Features:
- Completely editable in terms of shape, color, size and text
- This template has a built in color theme which is unaffected by copy-pasting
- Includes an icon family with 135 unique completely editable icons
- Drag and drop image placeholder
- Completely editable (using spreadsheet) data-driven charts for displaying statistics
- Completely editable vector graphics
Supports
Microsoft PowerPoint 2010, 2011, 2013, 2016
MacOffice 2016, MacOffice 365


Be the first to review “3D Chart for PowerPoint Template”