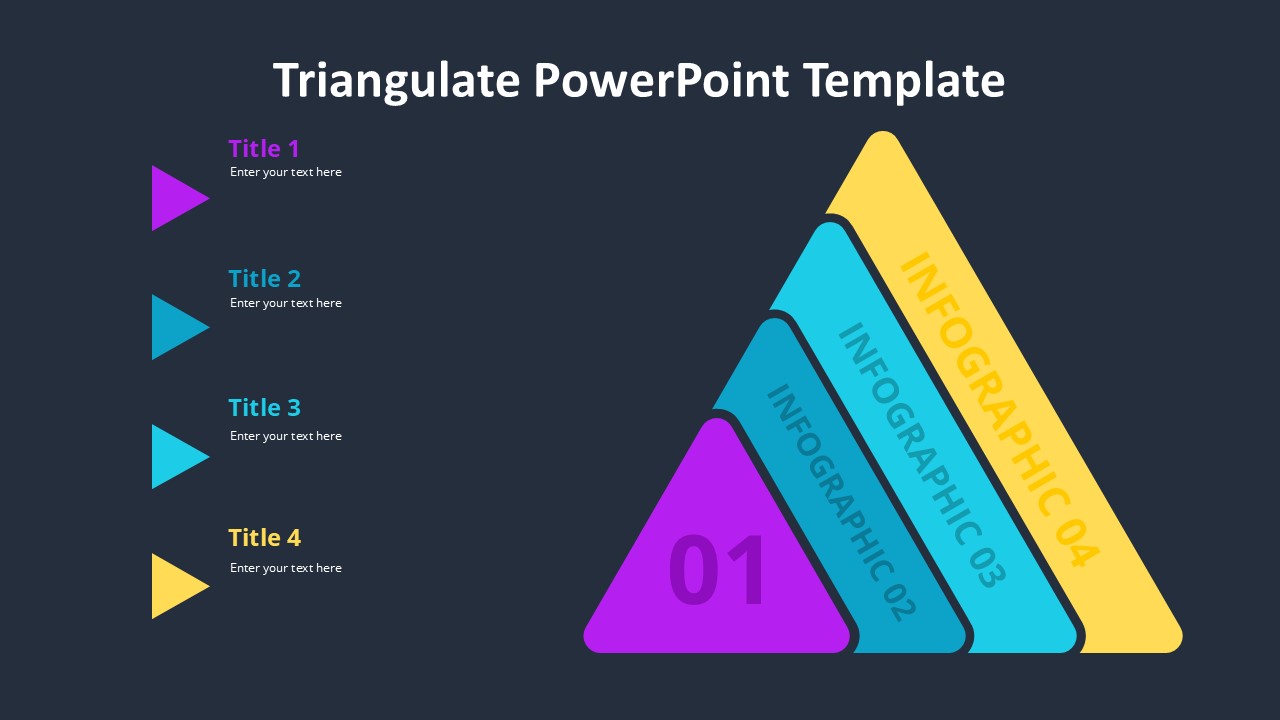
The Trend Analysis Infographic PowerPoint Presentation PPT is the perfect tool for professionals looking to showcase data trends in a visually appealing way. This comprehensive presentation template is designed to help users create engaging infographics that effectively communicate complex data and statistics.
The Trend Analysis Infographic PowerPoint Presentation PPT features a wide variety of slide designs, each carefully crafted to highlight different types of trends and analyses. From line graphs to bar charts, pie charts, and scatter plots, this template has everything you need to present your data in a clear and concise manner.
One of the key benefits of this PowerPoint presentation is its fully editable templates. Users can easily customize the colors, fonts, and layout of each slide to match their branding or personal style. This flexibility allows for endless possibilities when it comes to creating dynamic and engaging presentations.
In addition, the Trend Analysis Infographic PowerPoint Presentation PPT includes editable icons and graphics that can be resized and repositioned to fit the needs of any project. Whether you are highlighting sales figures, market trends, or survey results, this template has everything you need to make your data stand out.
Overall, the Trend Analysis Infographic PowerPoint Presentation PPT is a valuable tool for professionals looking to elevate their data presentations. With its fully editable templates and versatile slide designs, this template is sure to impress audiences and help you effectively communicate your data trends.


Be the first to review “Trend Analysis Infographic PowerPoint Presentation PPT”