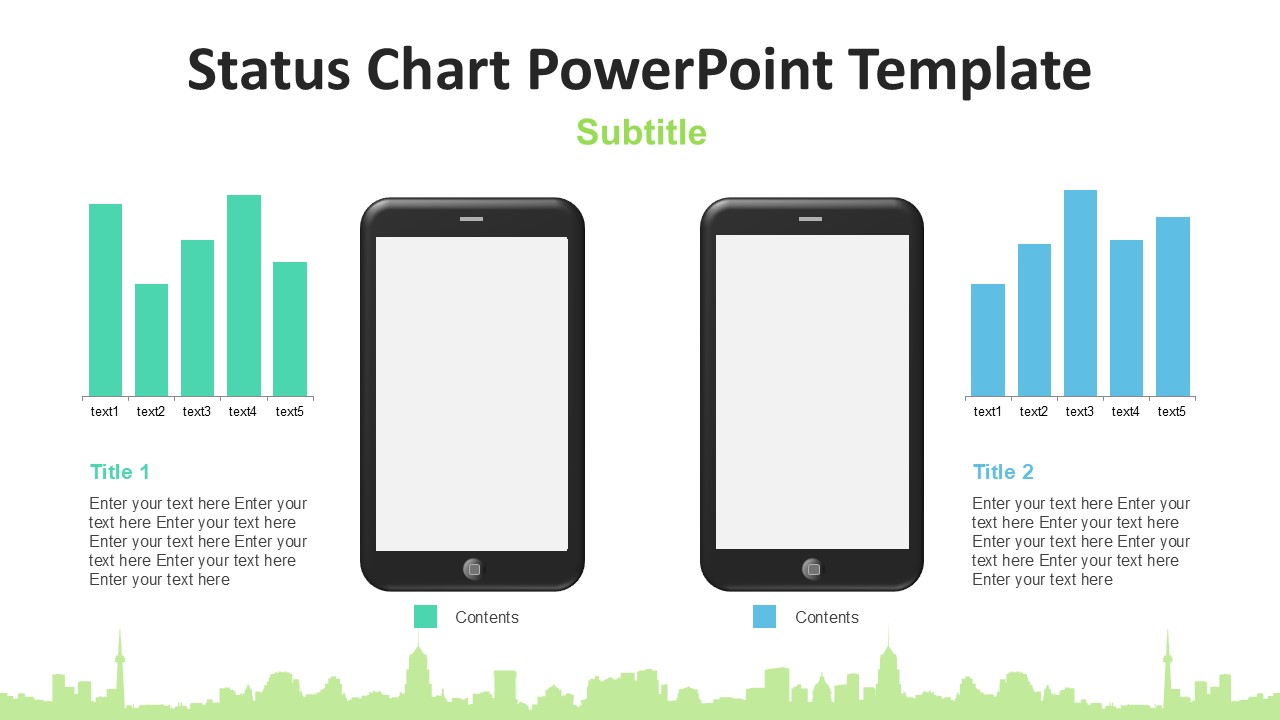
The Status Chart PowerPoint Template is a versatile and professional tool that allows you to create visually appealing charts and graphs to showcase project progress, business performance, or data analysis. With a clean and modern design, this template is perfect for corporate presentations, business reports, or academic projects.
This PowerPoint template includes a variety of status chart designs, such as stacked bar charts, line graphs, and pie charts, to help you effectively communicate your data in a clear and concise manner. The template also features customizable color schemes, fonts, and layout options, allowing you to tailor the charts to suit your specific needs and preferences.
Whether you need to present sales figures, project timelines, or market research data, the Status Chart PowerPoint Template has everything you need to create professional-looking charts that will impress your audience. With easy-to-use drag-and-drop functionality, you can quickly add your data to the charts and customize them to match your branding or presentation style.
Features of the Status Chart PowerPoint Template:
1. Fully editable charts and graphs – customize colors, fonts, and layout to suit your needs.
2. Easy-to-use drag-and-drop functionality for quick data input.
3. Modern and professional design suitable for business presentations.
4. Variety of chart styles included: stacked bar charts, line graphs, pie charts, and more.
5. Perfect for showcasing project progress, business performance, data analysis, and more.
6. Compatible with PowerPoint and other presentation software for seamless integration.
7. Includes detailed instructions for using the template effectively.
Overall, the Status Chart PowerPoint Template is a must-have tool for anyone looking to create impactful and visually engaging charts for their presentations. Whether you are a business professional, educator, or student, this template will help you convey your data effectively and leave a lasting impression on your audience.


Be the first to review “Status Chart PowerPoint Template”