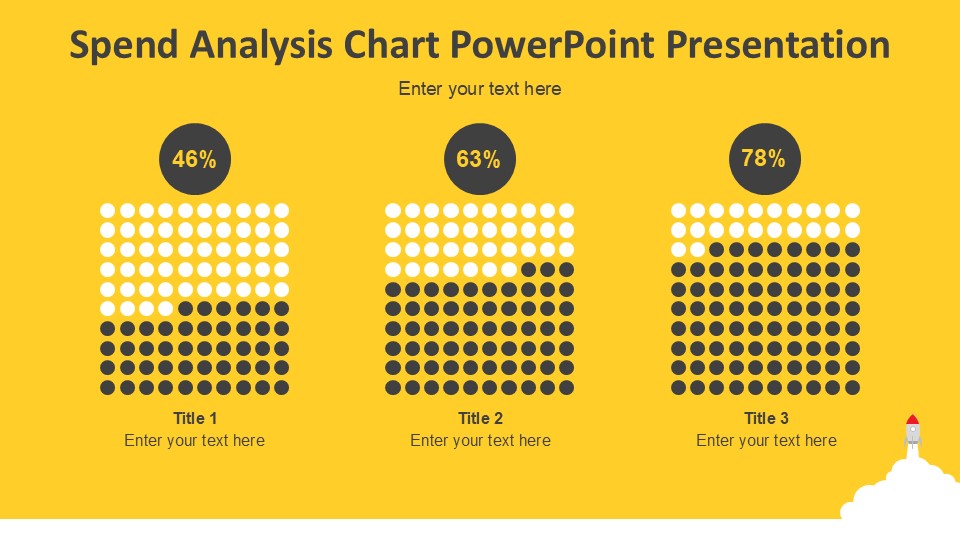
The Spend Analysis Chart PowerPoint Presentation is a versatile and professional tool designed to help businesses track and analyze their spending data in a clear and visually appealing way. With this presentation template, you can easily create detailed charts and graphs that provide valuable insights into your company’s finances.
This PowerPoint presentation includes a variety of slide layouts that are specifically designed for showcasing spending trends, budget comparisons, and expense breakdowns. Whether you need to present financial data to your team, stakeholders, or clients, this template will help you convey information effectively and impressively.
Features:
1. Fully Editable Charts: The Spend Analysis Chart PowerPoint Presentation comes with fully editable charts and graphs, allowing you to customize the data points, labels, colors, and more to suit your specific needs.
2. Easy-to-Use Layouts: The template features user-friendly layouts that make it easy to input your spending data and create professional-looking presentations in just a few clicks.
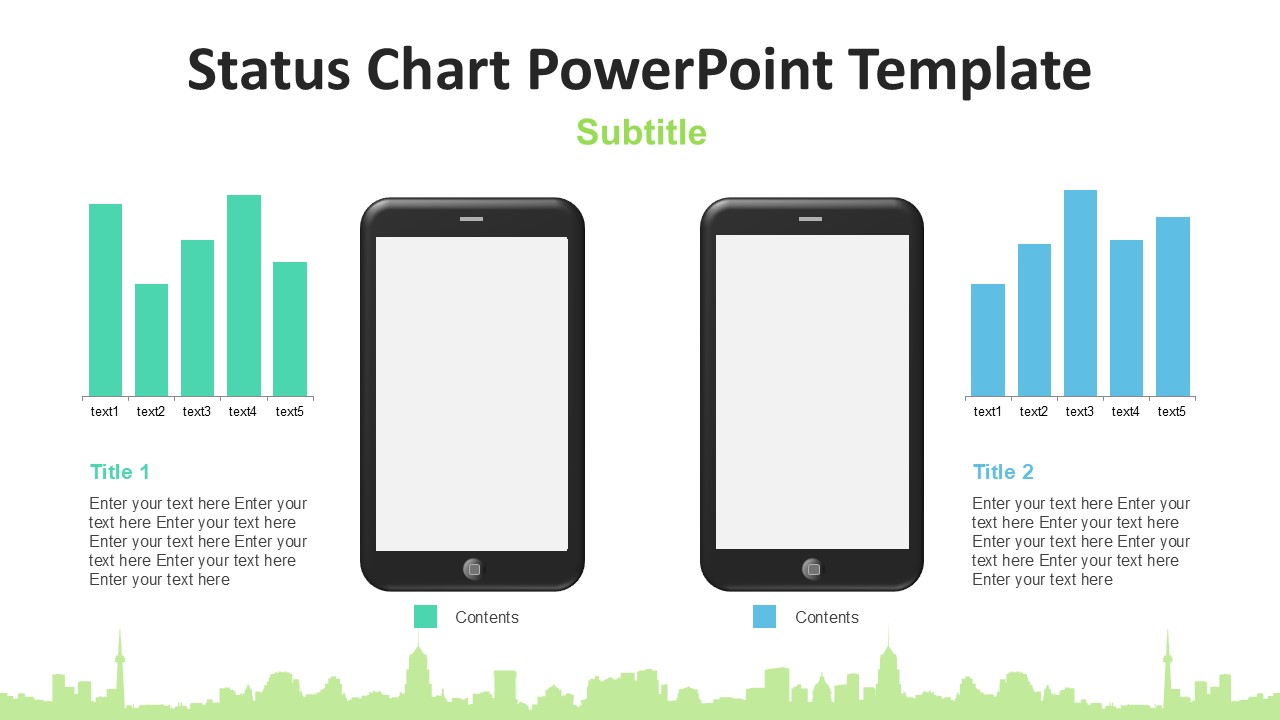
3. Data Visualization Tools: This presentation template includes a wide range of data visualization tools, such as bar charts, pie charts, line graphs, and more, to help you showcase your spending data in a compelling and easy-to-understand manner.
4. Customizable Design: You can easily customize the design elements of the slides, such as fonts, colors, backgrounds, and more, to create a presentation that reflects your brand and style.
5. Time-Saving Solution: With the Spend Analysis Chart PowerPoint Presentation, you can save time on creating charts and graphs from scratch and focus on analyzing and interpreting your spending data effectively.
Overall, this presentation template is an essential tool for any business looking to gain valuable insights into their spending patterns and make informed financial decisions. Whether you are a small startup or a large corporation, the Spend Analysis Chart PowerPoint Presentation will help you visualize your financial data in a clear and professional way.


Be the first to review “Spend Analysis Chart PowerPoint Presentation”