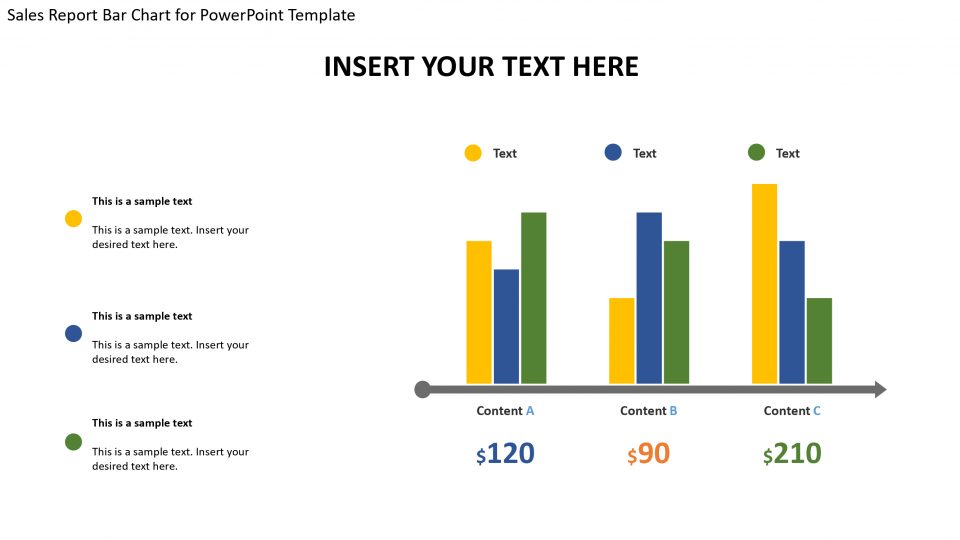
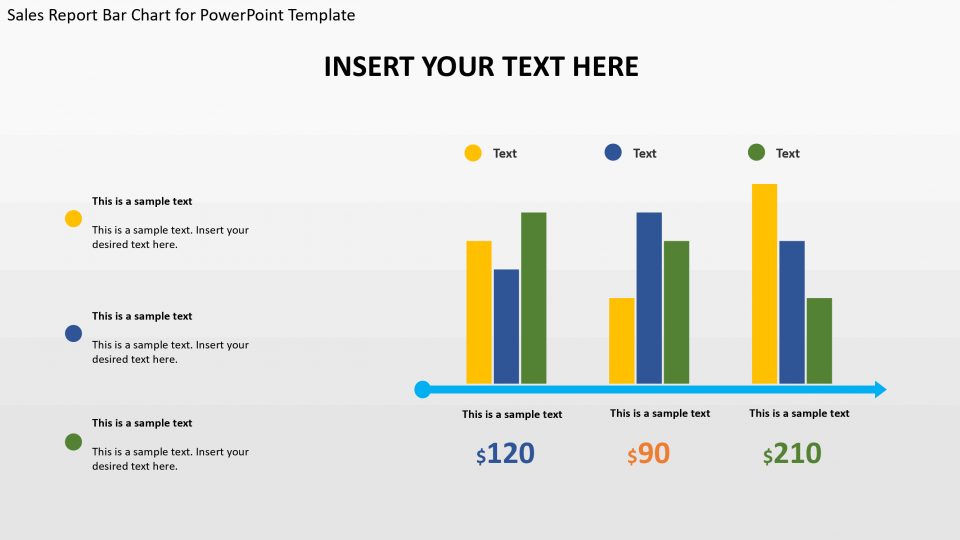
The sales report barchart powerpoint template includes a lot of bar graphs. The bars have various hues, for example, red, yellow, and green. The particular plan makes them emerge against the dull blue foundation. The illustrations are intended to be attractive. They present an expert structure that is perfect for formal business introductions.
Utilizing these slides, distinctive measurable information can be displayed. Most appropriately, be that as it may, the slides can be utilized to indicate either deals projections or authentic deals information. These slides can be utilized to examine diverse budgetary data, for the motivations behind settling on significant business choices. By demonstrating the data through diagrams, the moderator can feature inclines in the information. The watchers can have a visual piece of information with respect to where the information is prompting later on, in light of the structured presentation.
A particularly valuable slide in the format tells the best way to alter the information driven bar diagram, by giving a screen capture of the drop down menu that can be gets to by right-tapping the slide. The relating guidelines for the procedure can be found on the slide.
Features:
- Completely editable in terms of shape, color, size and text
- This template has a built in color theme which is unaffected by copy-pasting
- Includes an icon family with 135 unique completely editable icons
- Drag and drop image placeholder
- Completely editable (using spreadsheet) data-driven charts for displaying statistics
- Completely editable vector graphics
Supports
Microsoft PowerPoint 2010, 2011, 2013, 2016
MacOffice 2016, MacOffice 365




Be the first to review “Sales Report Bar Chart for PowerPoint Template”