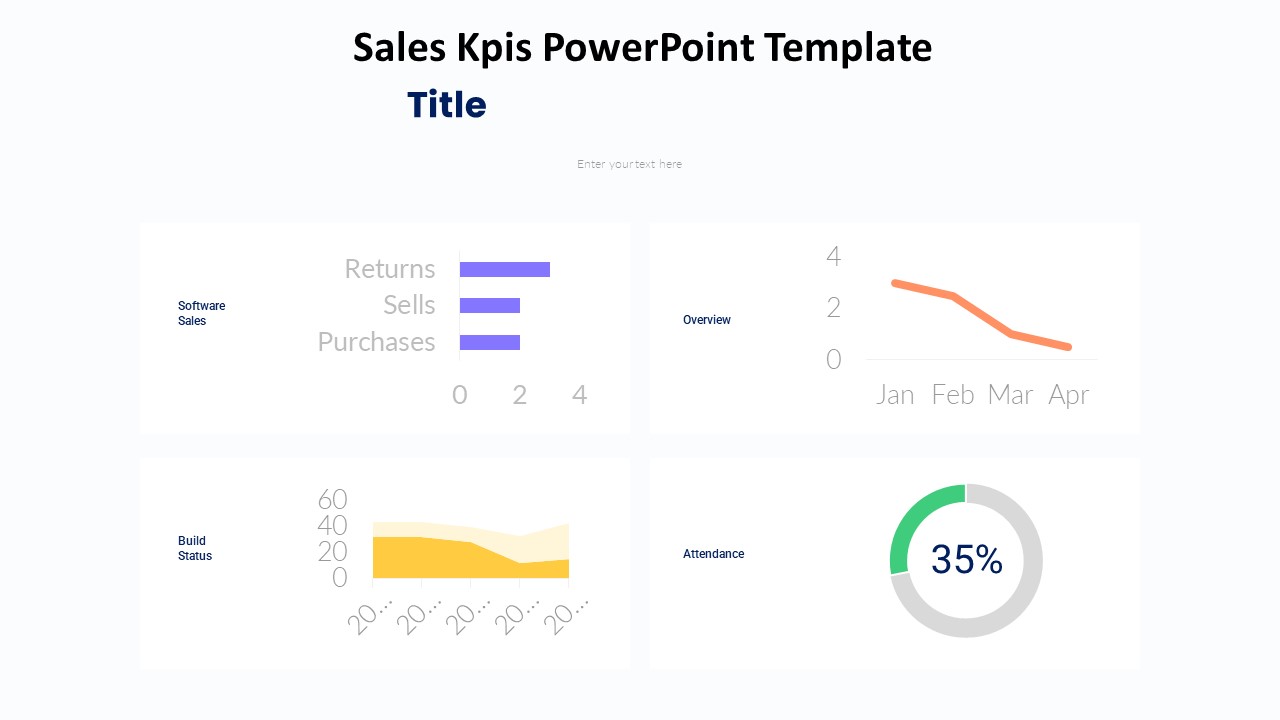
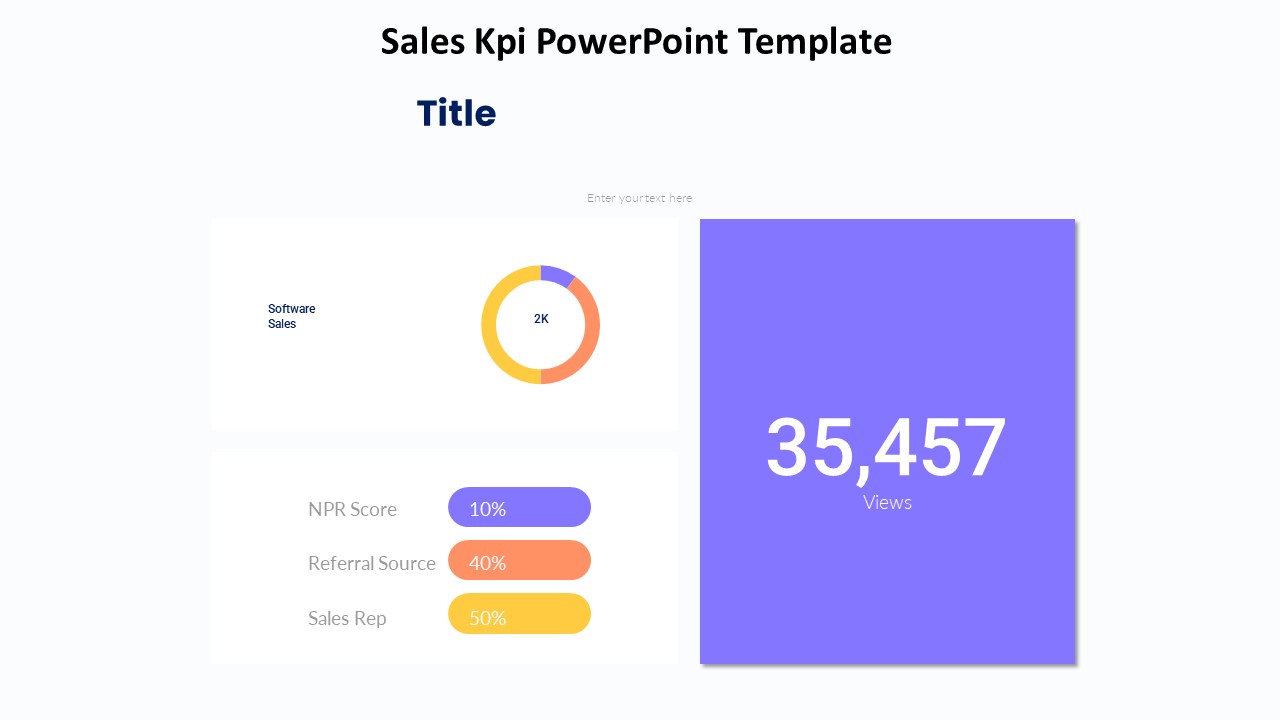
The Sales KPI Dashboard PowerPoint Template is a powerful tool designed to help businesses track and analyze their sales performance in a visually appealing format. This template is perfect for sales managers and teams looking to monitor key performance indicators (KPIs) such as revenue, sales growth, conversion rates, and more.
With easy-to-use slide layouts and customizable charts, this template allows users to create professional-looking dashboards that can be shared with stakeholders and team members. The sleek design and color scheme make it easy to identify trends and patterns at a glance, helping users make informed decisions to drive sales growth.
Features of this Sales KPI Dashboard PowerPoint Template include fully editable templates that can be customized to suit individual business needs. Users can easily update data points, charts, and graphs to reflect real-time sales performance, ensuring that the information presented is always accurate and up-to-date.
The template also includes a variety of slide designs, allowing users to display different KPIs on separate slides or create a comprehensive dashboard that provides an overview of overall sales performance. With the ability to add notes and annotations, users can provide context and insights to accompany the data, making it easier for viewers to understand the information presented.
In conclusion, the Sales KPI Dashboard PowerPoint Template is a valuable tool for businesses looking to improve their sales performance and track key metrics effectively. With its user-friendly design and customizable features, this template makes it easy to create informative and visually appealing dashboards that can drive sales success.


Be the first to review “Sales Kpi Dashboard PowerPoint Template”