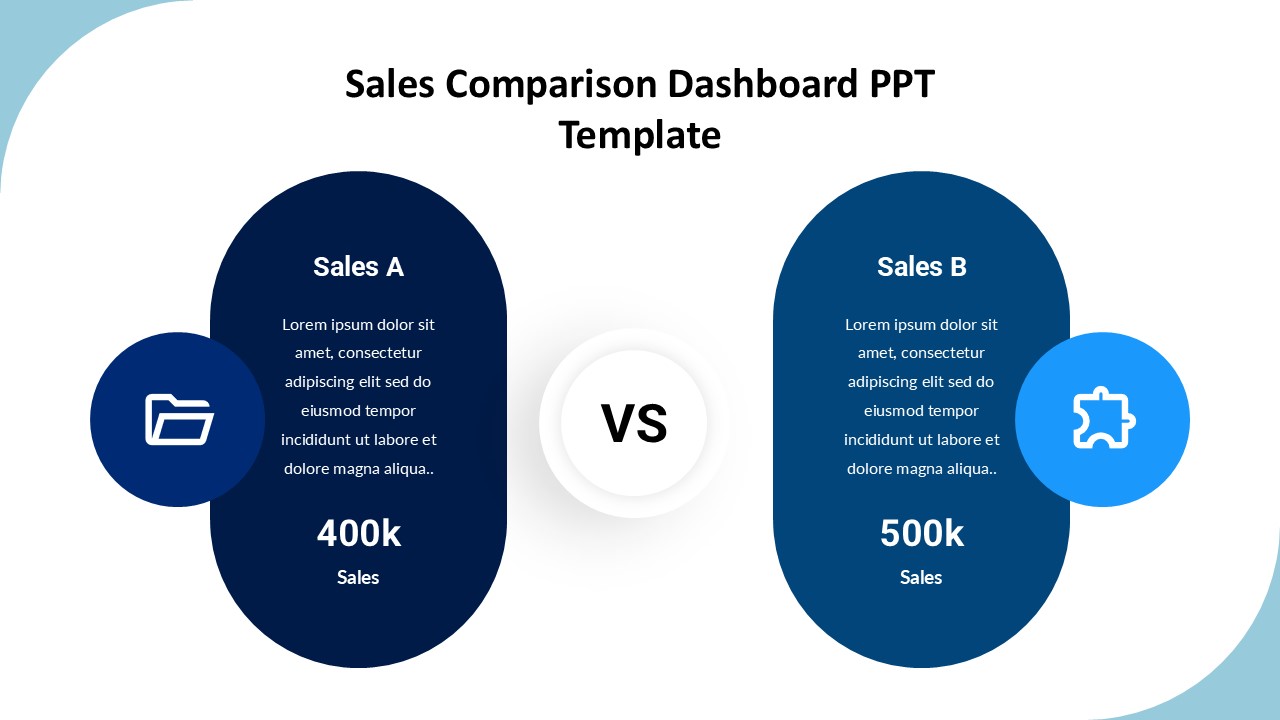
The Sales Comparison Dashboard PPT Template is the ultimate tool for businesses looking to visualize and analyze their sales data in a clear and comprehensive manner. This professional and modern template is designed to help you compare sales figures, track performance metrics, and make informed decisions to drive your business forward.
With a sleek and user-friendly layout, this PowerPoint template makes it easy to create interactive and engaging sales comparison dashboards. The template features various charts, graphs, and tables that can be easily customized to suit your specific needs. Whether you want to compare sales performance across different regions, products, or time periods, this template has got you covered.
One of the key features of the Sales Comparison Dashboard PPT Template is its fully editable design. This means that you can easily modify the colors, fonts, and layout of the template to match your brand’s visual identity. You can also add or remove elements to tailor the dashboard to your exact requirements. This level of customization ensures that your sales comparison dashboard will look professional and on-brand.
Furthermore, the template comes with a range of pre-designed slides that cover various aspects of sales comparison, including revenue trends, market share analysis, and sales performance by product category. These ready-to-use slides can save you time and effort in creating your sales comparison dashboard, allowing you to focus on interpreting the data and making strategic business decisions.
In conclusion, the Sales Comparison Dashboard PPT Template is a versatile and powerful tool for businesses that want to better understand their sales performance and identify opportunities for growth. With its fully editable templates and comprehensive features, this template can help you create impactful and visually appealing sales comparison dashboards that drive results.


Be the first to review “Sales Comparison Dashboard PPT Template”