The Profit and Loss Dashboard PowerPoint Template is a powerful tool designed to help businesses track their financial performance with ease. This visually appealing template allows users to present complex financial data in a clear and understandable way.
With a sleek and modern design, this template features various charts, graphs, and tables that can be easily customized to suit your specific needs. Whether you are a small business owner looking to analyze your company’s profitability or a financial analyst preparing a presentation for stakeholders, this template has got you covered.
Key Features:
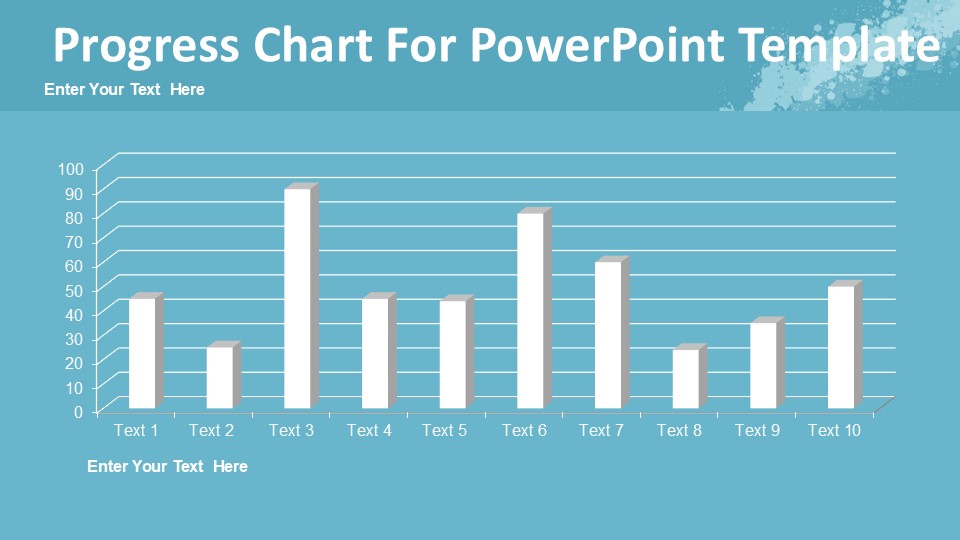
1. Fully Editable Charts and Graphs: The template includes a wide range of customizable charts and graphs that allow you to visualize your financial data in a way that is easy to understand.
2. Data Driven Slides: With data-driven slides, you can easily update your financial information without having to manually adjust each slide. This saves you time and ensures that your presentation is always up to date.
3. Easy-to-Use Interface: The template is user-friendly and intuitive, making it easy for even those with limited PowerPoint experience to create professional-looking presentations.
4. Flexible Layout Options: The template offers a variety of layout options, allowing you to choose the design that best fits your presentation style.
5. Color Customization: With the ability to customize colors, you can match the template to your company’s branding or create a visually appealing presentation that captures your audience’s attention.
Overall, the Profit and Loss Dashboard PowerPoint Template is a versatile and powerful tool that can help you take your financial presentations to the next level. Whether you are presenting to investors, shareholders, or company executives, this template will help you communicate key financial information effectively and professionally.


Be the first to review “Profit And Loss Dashboard PowerPoint Template”