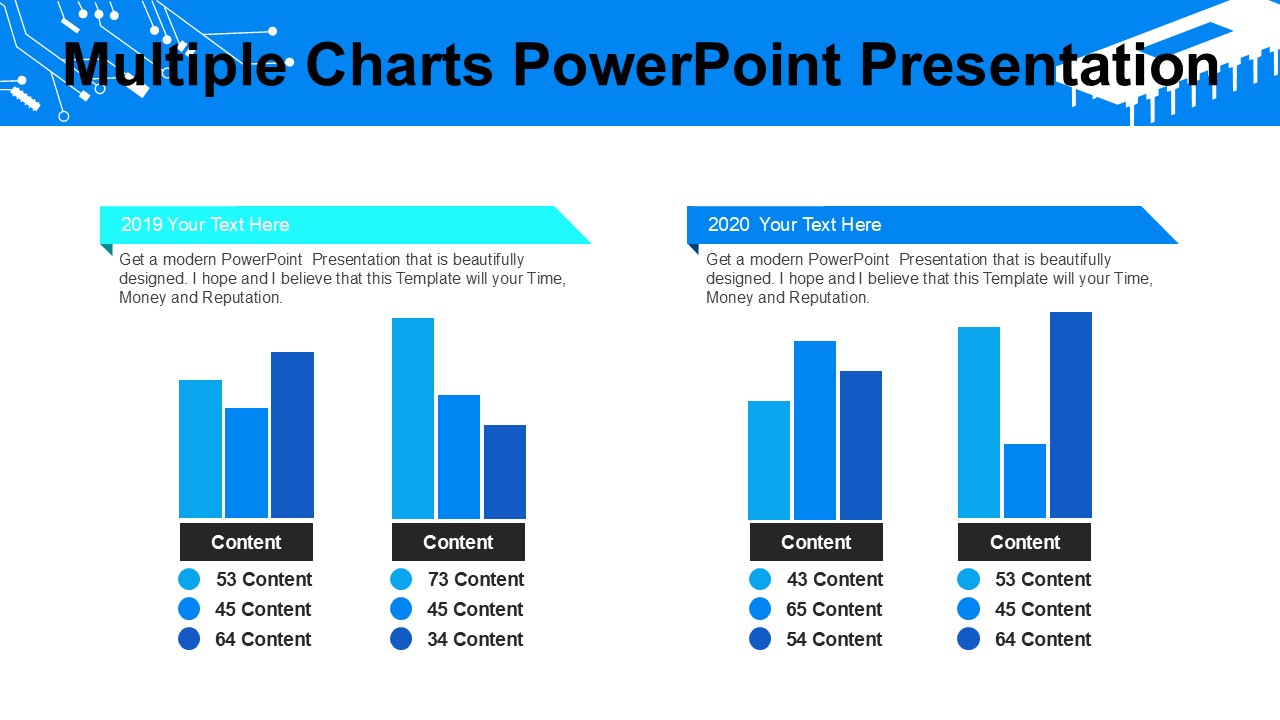
Upgrade your presentation game with our Multiple Charts PowerPoint Presentation. This versatile set of slides is perfect for showcasing data and statistics in a clear and visually appealing way.
Whether you need to present financial figures, sales trends, survey results, or any other type of data, this PowerPoint presentation has got you covered. With a variety of chart styles to choose from, including bar graphs, pie charts, line graphs, and more, you can easily find the perfect way to display your information.
Our Multiple Charts PowerPoint Presentation is fully editable, allowing you to customize the slides to suit your specific needs. Change the colors, fonts, and sizes to match your brand’s style and create a professional-looking presentation in minutes.
Features:
1. Fully editable templates – Customize the slides to fit your needs
2. Variety of chart styles – Choose from bar graphs, pie charts, line graphs, and more
3. Professional design – Create a polished presentation that impresses your audience
4. Easy to use – Simply add your data and information to the slides
5. Versatile – Suitable for all types of data and statistics presentations
Enhance your presentations with our Multiple Charts PowerPoint Presentation and take your data visualization to the next level.


Be the first to review “Multiple Charts PowerPoint Presentation”