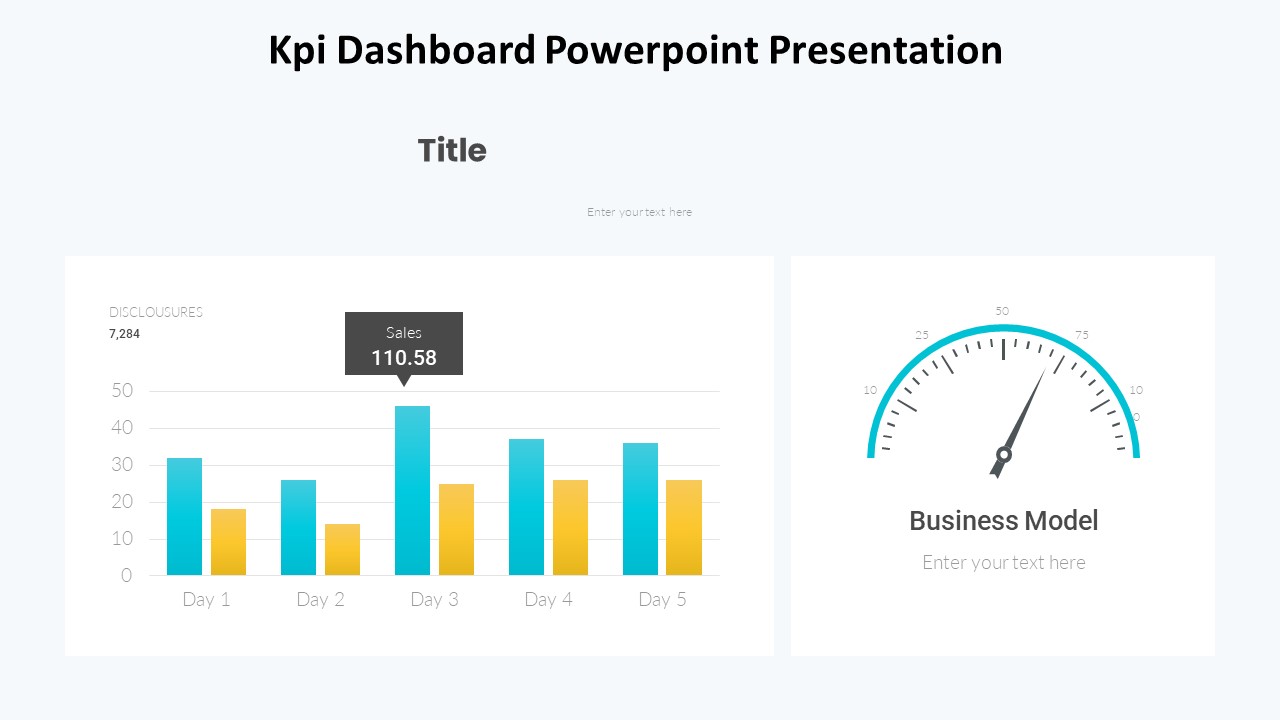
The KPI Dashboard PowerPoint Presentation is a powerful tool for businesses looking to track and analyze their key performance indicators in a visually appealing and easy-to-understand format. This professionally designed template allows users to effectively communicate complex data and metrics to stakeholders, team members, and decision-makers.
Featuring a clean and modern design, the KPI Dashboard PowerPoint Presentation includes a variety of slide layouts that can be customized to suit individual needs. With a user-friendly interface and fully editable elements, users can easily add, remove, or modify data points, charts, graphs, and tables to create a customized dashboard that meets their specific requirements.
Key features of the KPI Dashboard PowerPoint Presentation include:
1. Fully editable templates: Easily customize the color scheme, fonts, layout, and content to match your brand guidelines and preferences.
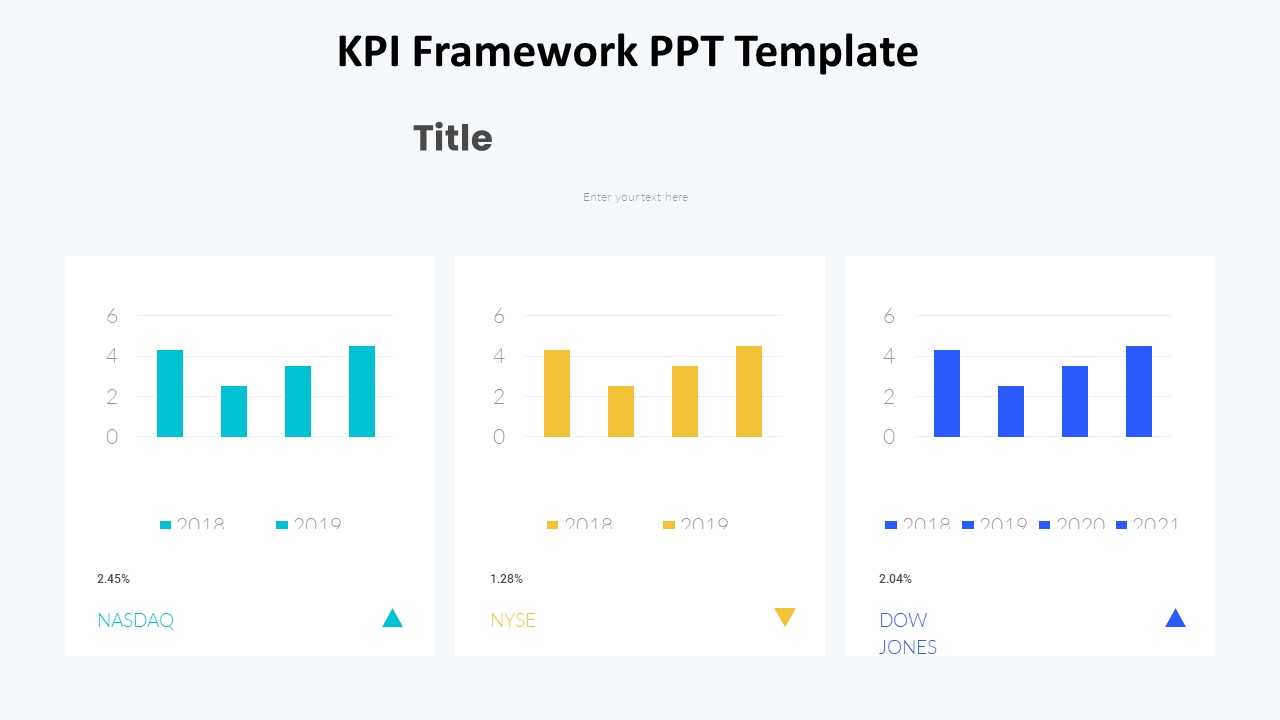
2. Data visualization tools: Present complex data and metrics in a clear and concise manner using charts, graphs, and tables.
3. Interactive elements: Add interactive elements such as clickable buttons, hyperlinks, and animations to engage your audience and make your presentation more dynamic.
4. Easy data input: Input data directly into the dashboard using Excel or other data sources for seamless integration and updates.
5. Multiple slide layouts: Choose from a variety of slide layouts including summary slides, comparison slides, trend analysis slides, and more to effectively communicate your KPIs.
Overall, the KPI Dashboard PowerPoint Presentation is a versatile and user-friendly tool that can help businesses track, analyze, and communicate key performance indicators with ease. Whether you’re presenting to internal teams, clients, or stakeholders, this template is sure to impress with its professional design and customizable features.


Be the first to review “Kpi Dashboard Powerpoint Presentation”