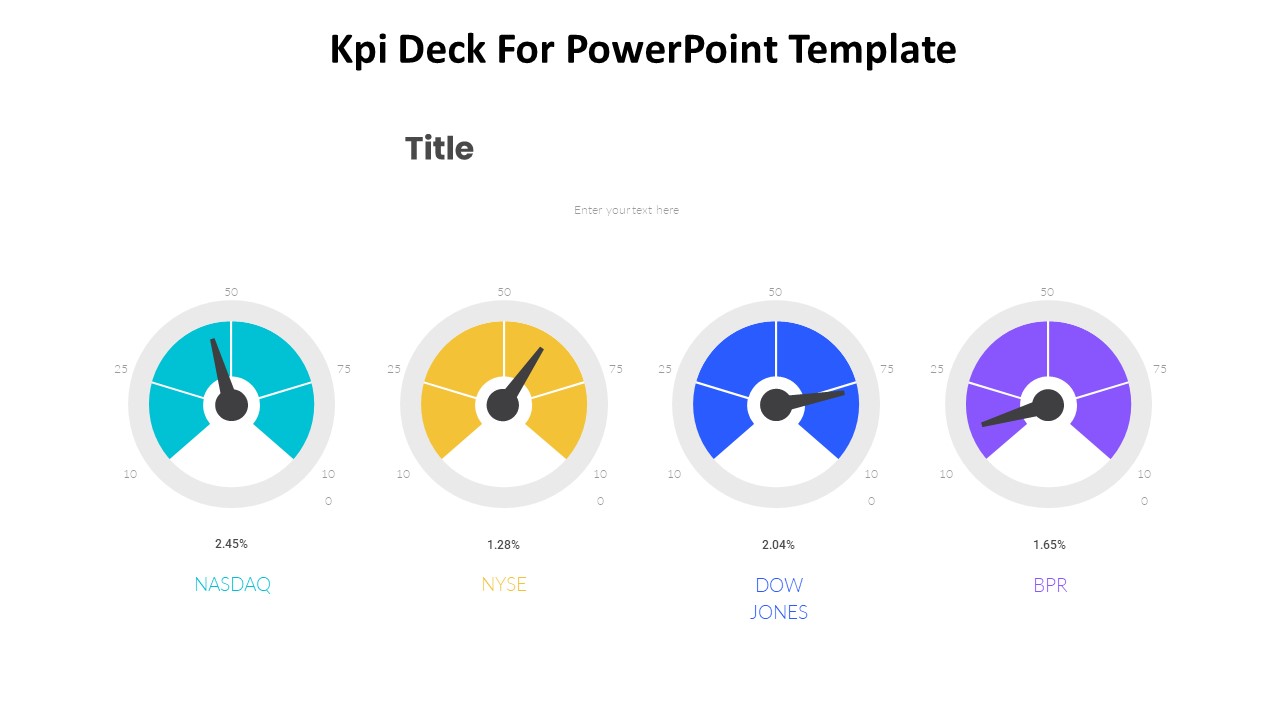
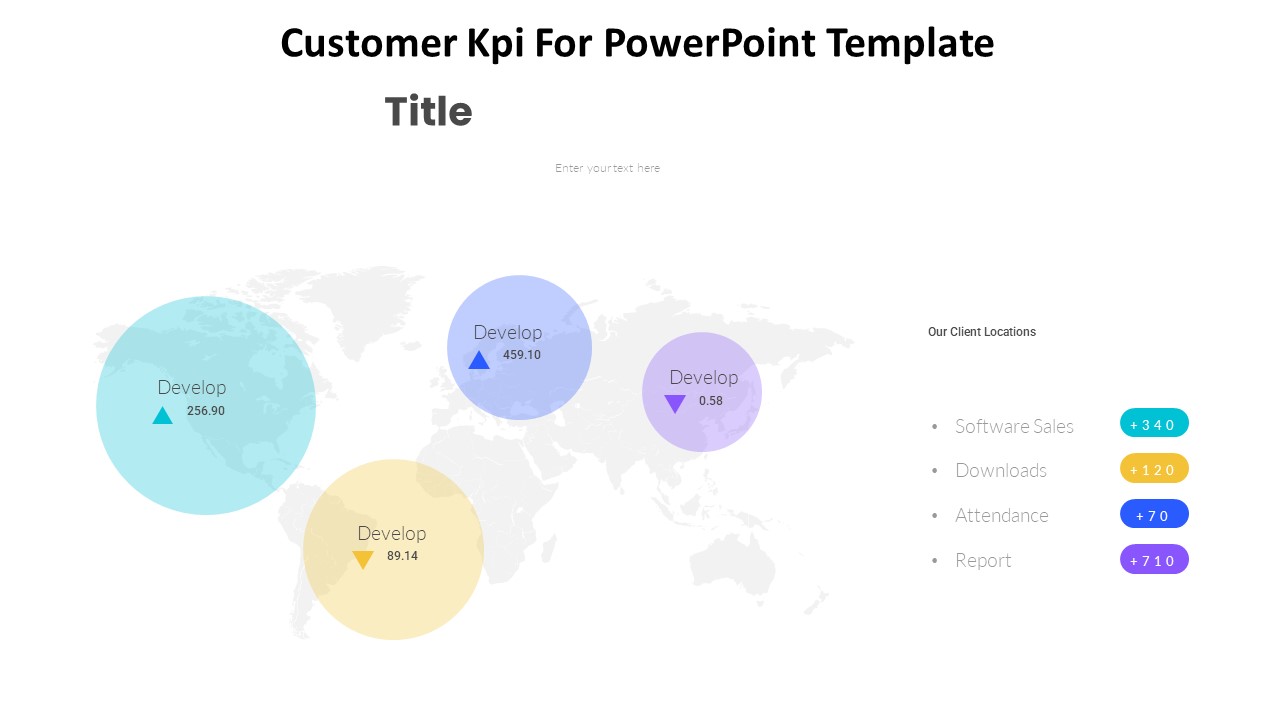
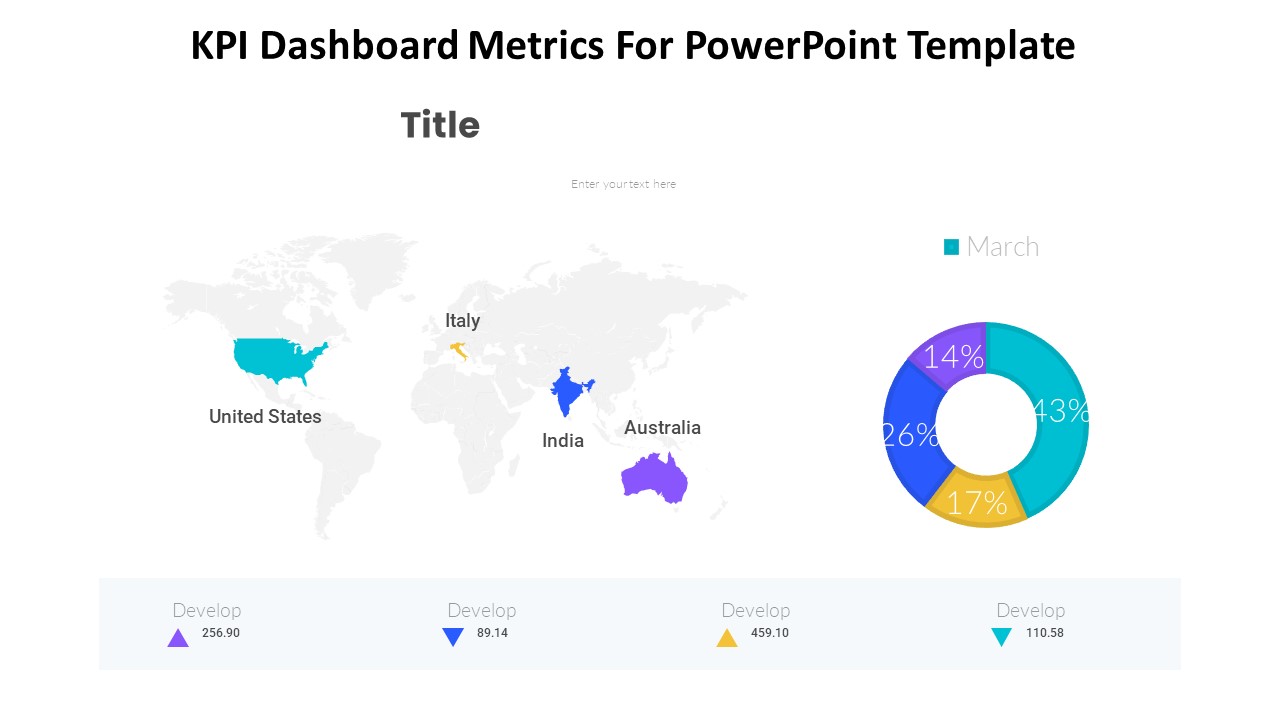
Are you looking for an efficient way to track your Key Performance Indicators (KPIs) and present them in a clear and concise manner? Look no further than the KPI Dashboard Metrics for PowerPoint Template.
This professionally designed template offers a variety of dashboard layouts and designs to help you visualize and analyze your KPI data effectively. Whether you need to monitor sales performance, marketing metrics, financial data, or any other key indicators, this template has you covered.
With easy-to-use features and customizable options, the KPI Dashboard Metrics for PowerPoint Template allows you to tailor your dashboard to meet your specific needs. You can easily input your data, adjust the colors and fonts to match your branding, and add or remove elements as necessary.
Whether you are presenting to executives, stakeholders, or team members, this template will help you communicate important KPIs in a visually appealing way. Impress your audience with clear charts, graphs, and diagrams that highlight the most crucial information at a glance.
Key Features:
1. Fully editable templates – Customize the design to suit your needs and branding requirements.
2. Easy-to-use – Input your data quickly and easily to create a personalized dashboard.
3. Multiple layouts – Choose from a variety of designs to find the best fit for your data.
4. Professional design – Impress your audience with visually appealing charts, graphs, and diagrams.
5. Versatile – Suitable for tracking a wide range of KPIs across various industries and departments.
Take your KPI tracking and reporting to the next level with the KPI Dashboard Metrics for PowerPoint Template. Download it today and start visualizing your data in a way that is both informative and engaging.


Be the first to review “KPI Dashboard Metrics For PowerPoint Template”