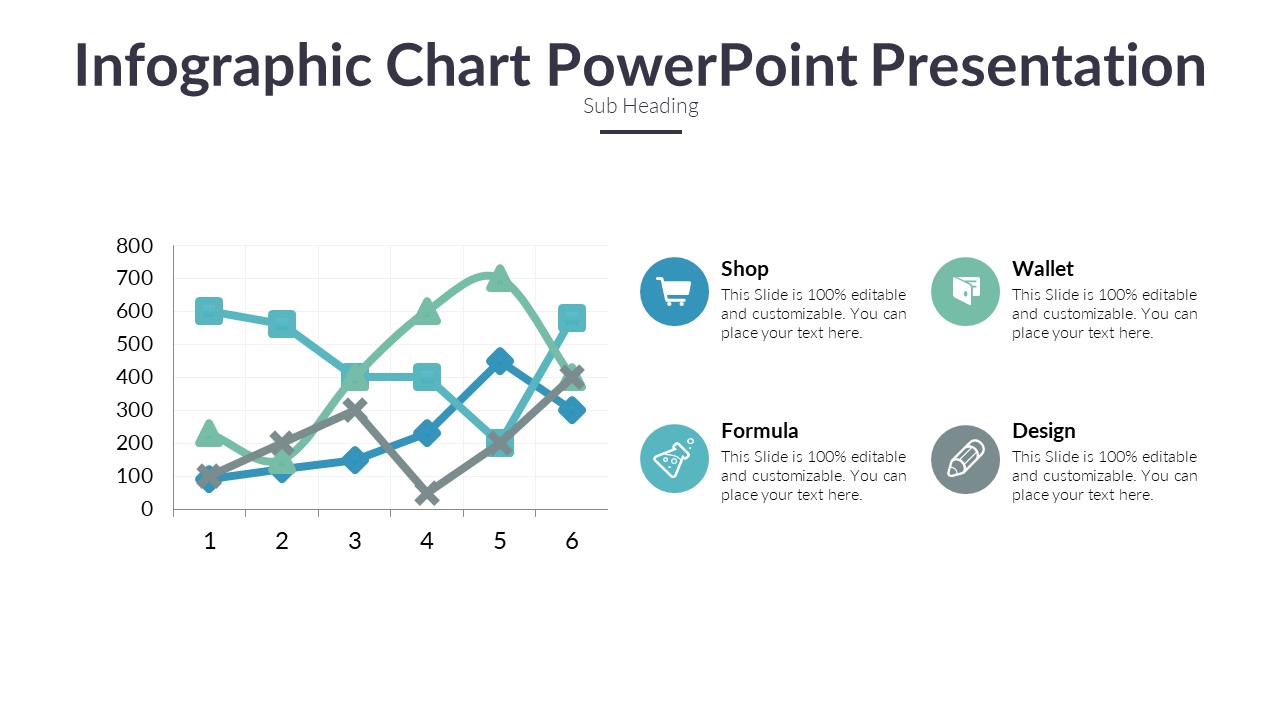
Infographic charts are a powerful tool for visually presenting data in a clear and concise manner. With the Infographic Chart PowerPoint Presentation, you can easily create engaging and informative charts that will captivate your audience.
This PowerPoint presentation includes a wide variety of infographic chart templates, enabling you to choose the perfect chart style for your data. Whether you need a pie chart, bar graph, line graph, or any other type of chart, this presentation has you covered. Each template is fully editable, allowing you to customize the colors, fonts, and data points to suit your specific needs.
One of the key features of the Infographic Chart PowerPoint Presentation is its ease of use. With just a few clicks, you can insert your data into the charts and create a professional-looking presentation in no time. The intuitive design of the templates makes it simple to update and modify the charts as needed, saving you valuable time and effort.
Another standout feature of this PowerPoint presentation is its versatility. Whether you are creating a presentation for a business meeting, a school project, or a marketing campaign, the infographic chart templates can be tailored to suit any purpose. From showcasing sales data to illustrating key trends, these charts are sure to enhance the impact of your presentation.
In conclusion, the Infographic Chart PowerPoint Presentation is a valuable resource for anyone looking to create visually appealing and informative charts. With its fully editable templates, ease of use, and versatility, this presentation will help you effectively communicate your data and captivate your audience.


Be the first to review “Infographic Chart PowerPoint Presentation”