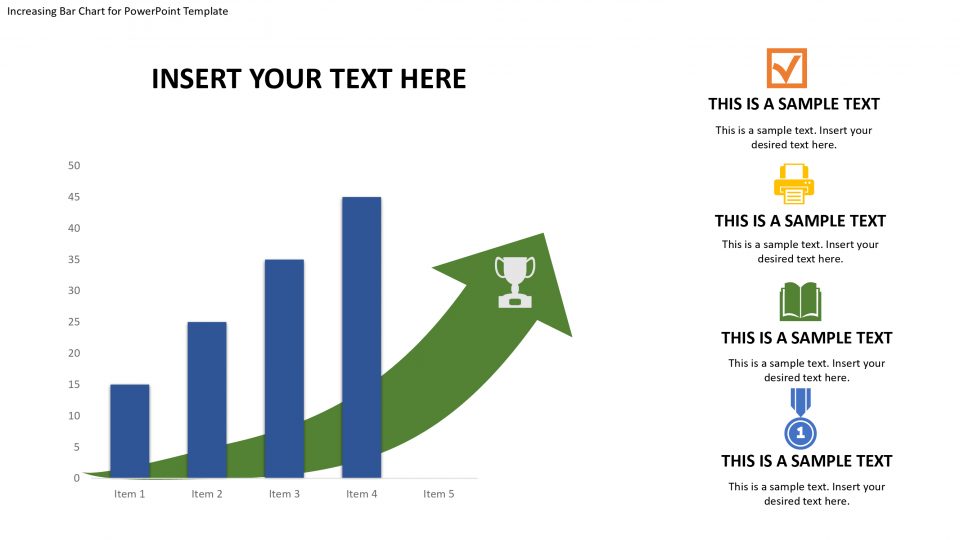
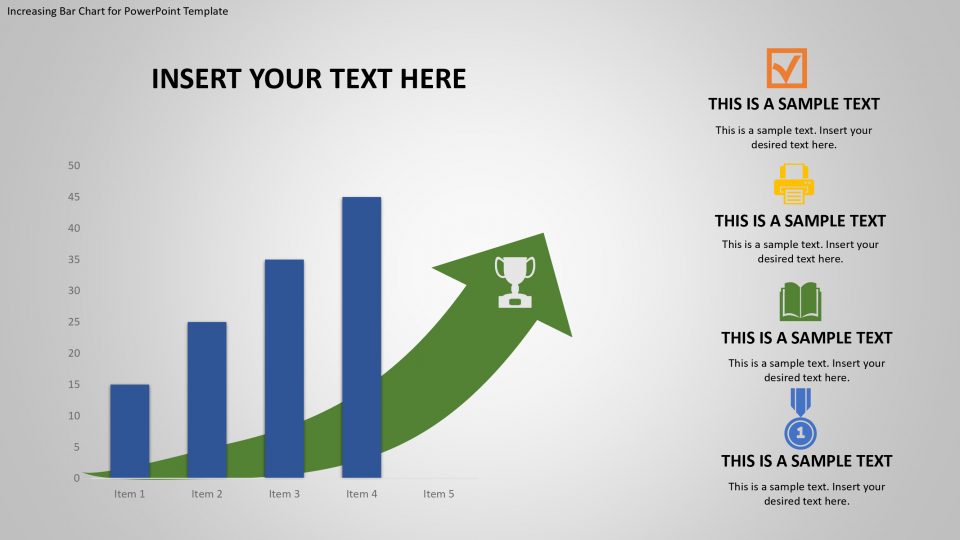
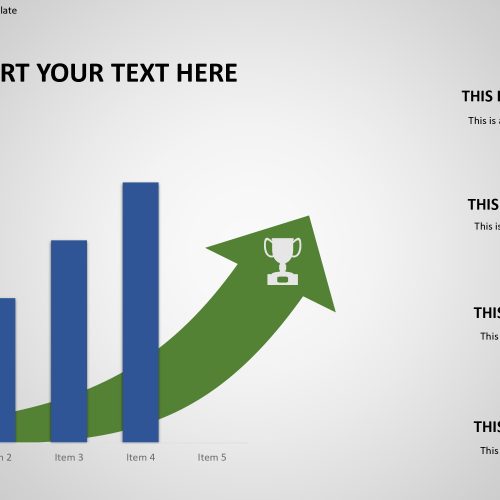
The 3D bar chart growth powerpoint template is particularly identified with business ideas. It implies that there is development and advancement in an organization. A bar diagram can catch this quantitative information to a photographic report. These records are taken through a timeframe. The budgetary viewpoint can allude to showcasing upgrades or benefit that the business accomplishes each year. Demonstrating the qualities through this PowerPoint layout can enable the client to break down the information more profound. Examples and failures that can’t be seen on level records can develop in the graph.
A few slides incorporate an arrow that focuses at the bearing of the advancement. The PowerPoint article makes it is simpler to distinguish whether the outline has a diving or climbing request. The dollar sign in the initial 4 slides represent the association of cash. The slide plans additionally include a static title zone. The client can generally utilize this part to projectile significant focuses. This layout empowers the moderator to have negligible content on the PowerPoint. Utilizing the PowerPoint shapes menu, the client can rapidly change the shapes. Hues are completely customisable too to suit the necessities of the report.
This PowerPoint layout is perfect for deals and advertising introductions. It has an adaptable structure so the client can customize it to fit any business-related or budgetary idea. It is a cutting edge contact to any expert setting.
Features:
- Completely editable in terms of shape, color, size and text
- This template has a built in color theme which is unaffected by copy-pasting
- Includes an icon family with 135 unique completely editable icons
- Drag and drop image placeholder
- Completely editable (using spreadsheet) data-driven charts for displaying statistics
- Completely editable vector graphics
Supports
Microsoft PowerPoint 2010, 2011, 2013, 2016
MacOffice 2016, MacOffice 365



Be the first to review “3D Bar Chart Growth for PowerPoint Template”