
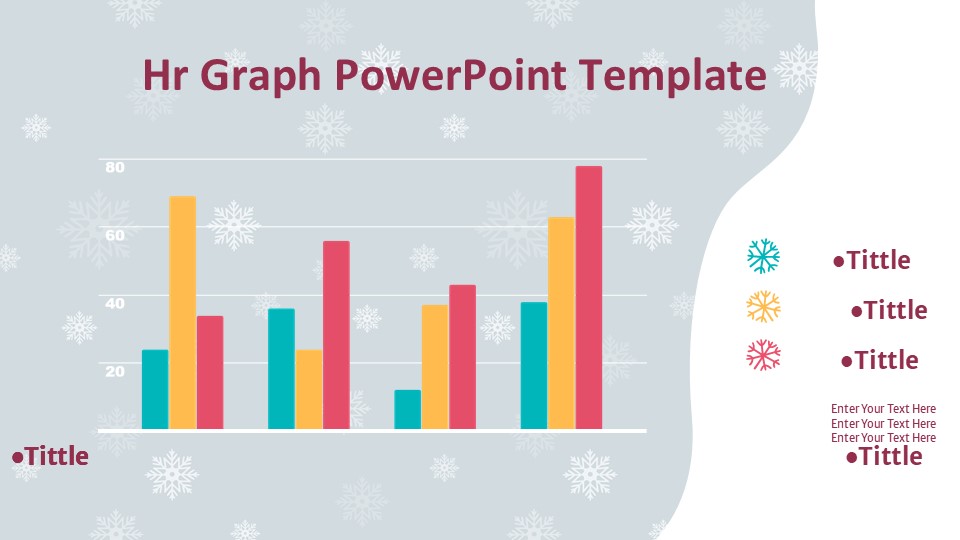
The HR Graph PowerPoint Template is a versatile and professional tool designed to help HR professionals and business leaders create visually engaging presentations. This template features a sleek and modern design, with a focus on showcasing HR data and trends in an easy-to-understand format.
With a range of customizable graphs, charts, and diagrams, this template allows users to effectively communicate key HR metrics such as employee turnover rates, performance evaluations, recruitment trends, and more. Whether presenting to company stakeholders, conducting training sessions, or analyzing HR data internally, this template provides the tools needed to convey information clearly and concisely.
Key features of the HR Graph PowerPoint Template include:
1. Fully editable graphs and charts: Easily customize the data points, colors, and styles of the included graphs and charts to suit your specific HR reporting needs.
2. Data-driven design: This template is designed to help users showcase HR data in a visually compelling way, making it easier for audiences to understand key metrics and trends.
3. Easy-to-use layout: The template features a user-friendly layout that allows users to quickly add and edit content, saving time and streamlining the presentation creation process.
4. Professional design: With a clean and modern design aesthetic, this template is ideal for use in a professional setting, helping users create polished and impactful presentations.
Overall, the HR Graph PowerPoint Template is a valuable resource for HR professionals looking to effectively communicate key HR metrics and trends. Whether presenting to colleagues, clients, or executives, this template provides the tools needed to create engaging and informative presentations that make an impact.

Be the first to review “Hr Graph PowerPoint Template”