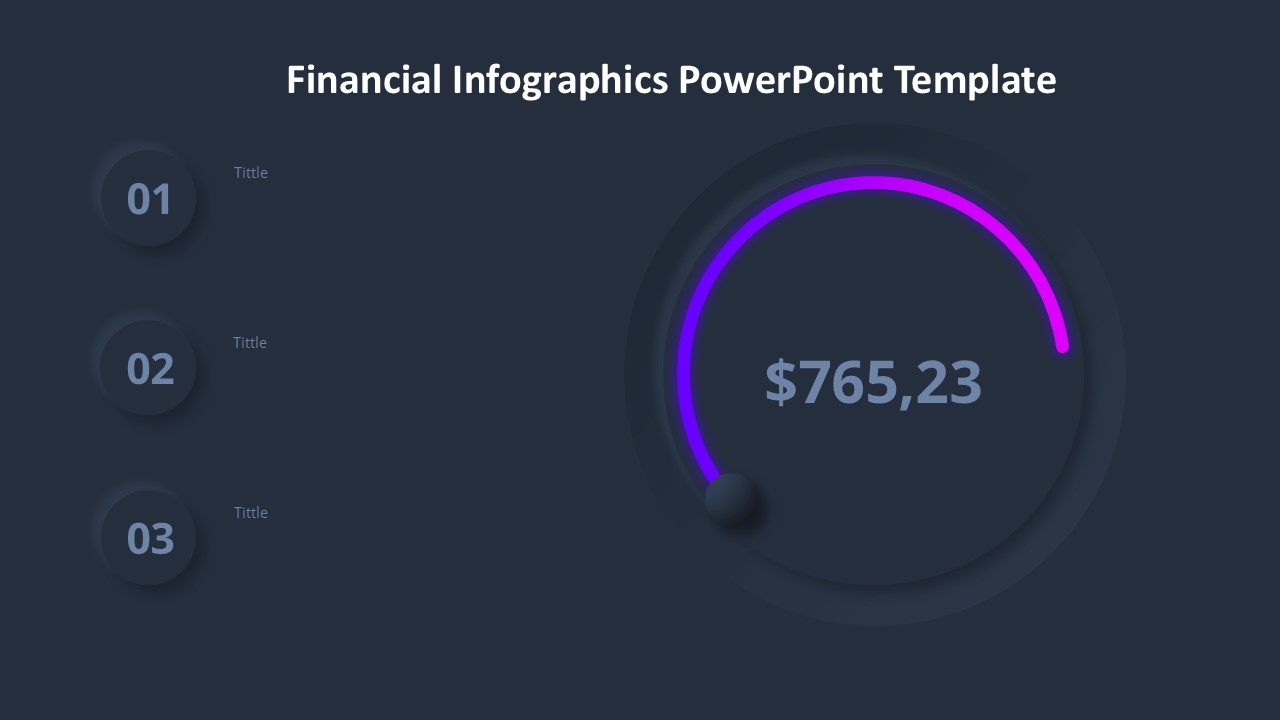
The Financial Infographics PowerPoint Template is a versatile and professional tool that can help you create stunning presentations to showcase financial data and information in a visually appealing way. This template is designed with a modern and clean style, making it suitable for a wide range of finance-related presentations.
With this template, you can easily customize each slide to fit your own data and information. The infographics included in the template are fully editable, allowing you to modify colors, shapes, and text to match your branding or presentation theme. Whether you are preparing a financial report, business plan, or investment pitch, this template provides you with the tools you need to present your information effectively.
Key Features:
1. Fully editable infographics: Easily customize colors, shapes, and text to create unique and impactful visuals for your presentation.
2. Modern and professional design: The template features a clean and contemporary design that is suitable for corporate and finance-related presentations.
3. Wide range of infographics: From bar charts and pie graphs to timelines and comparison slides, the template includes a variety of infographics to display your financial data creatively.
4. Easy to use: The template is user-friendly and intuitive, making it simple for anyone to create professional-looking slides without any design experience.
5. Versatile and adaptable: Whether you need to present financial results, market analysis, or investment opportunities, the template can be easily customized to suit your specific needs.
Overall, the Financial Infographics PowerPoint Template is a valuable tool for professionals who need to present financial information in a clear and impactful way. With its fully editable templates and range of infographics, this template can help you create engaging and informative presentations that will impress your audience.


Be the first to review “Financial Infographics PowerPoint Template”