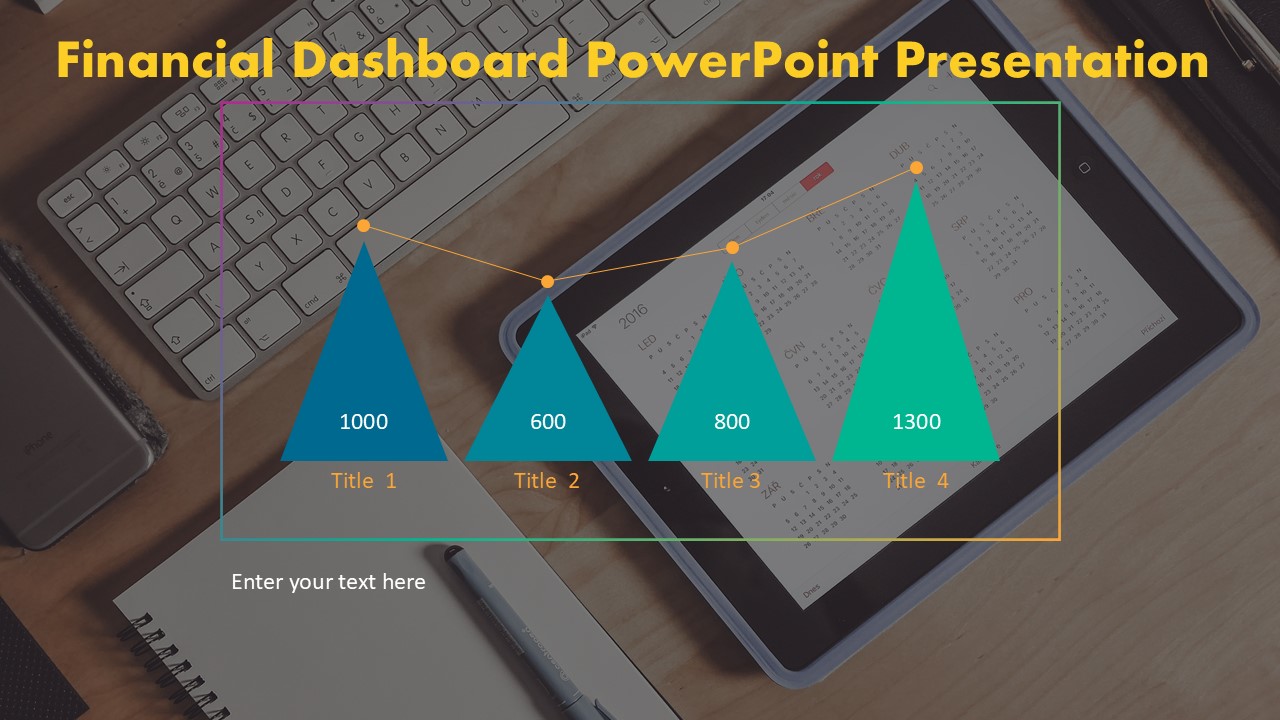
Looking to visualize your financial data with ease? Our Financial Dashboard PowerPoint Presentation is the perfect solution for businesses and professionals looking to create impactful financial reports and presentations.
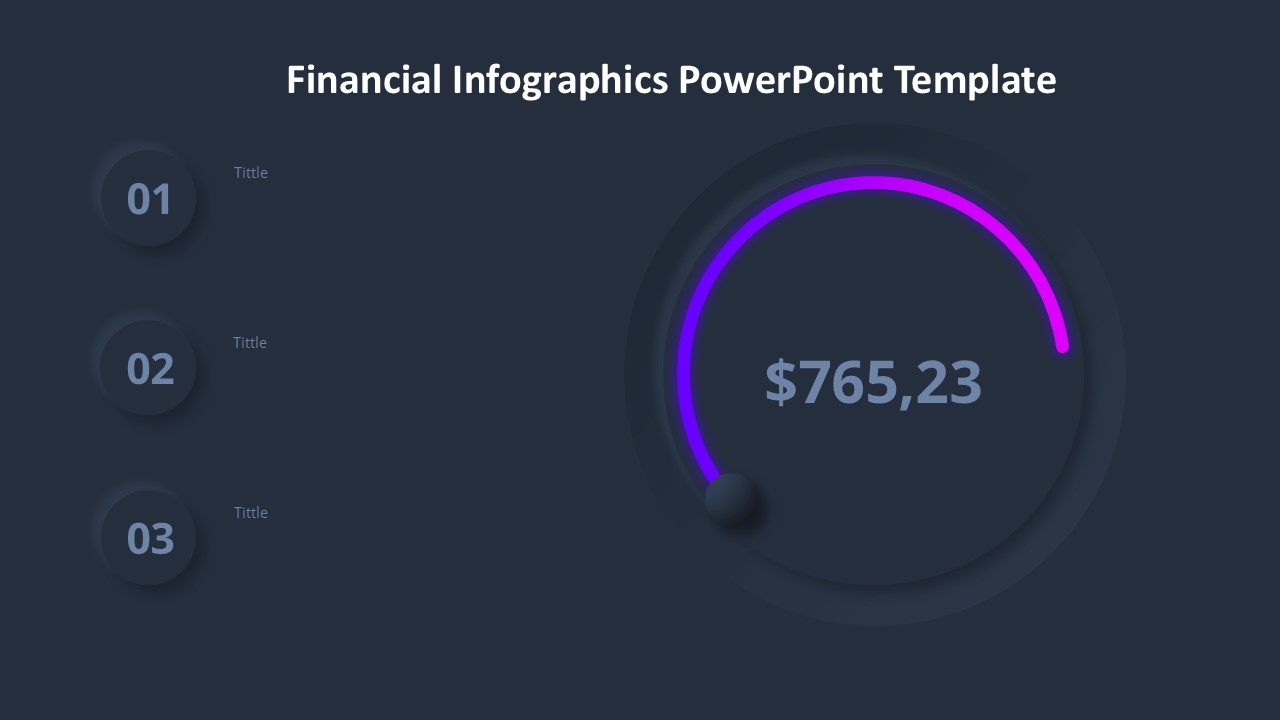
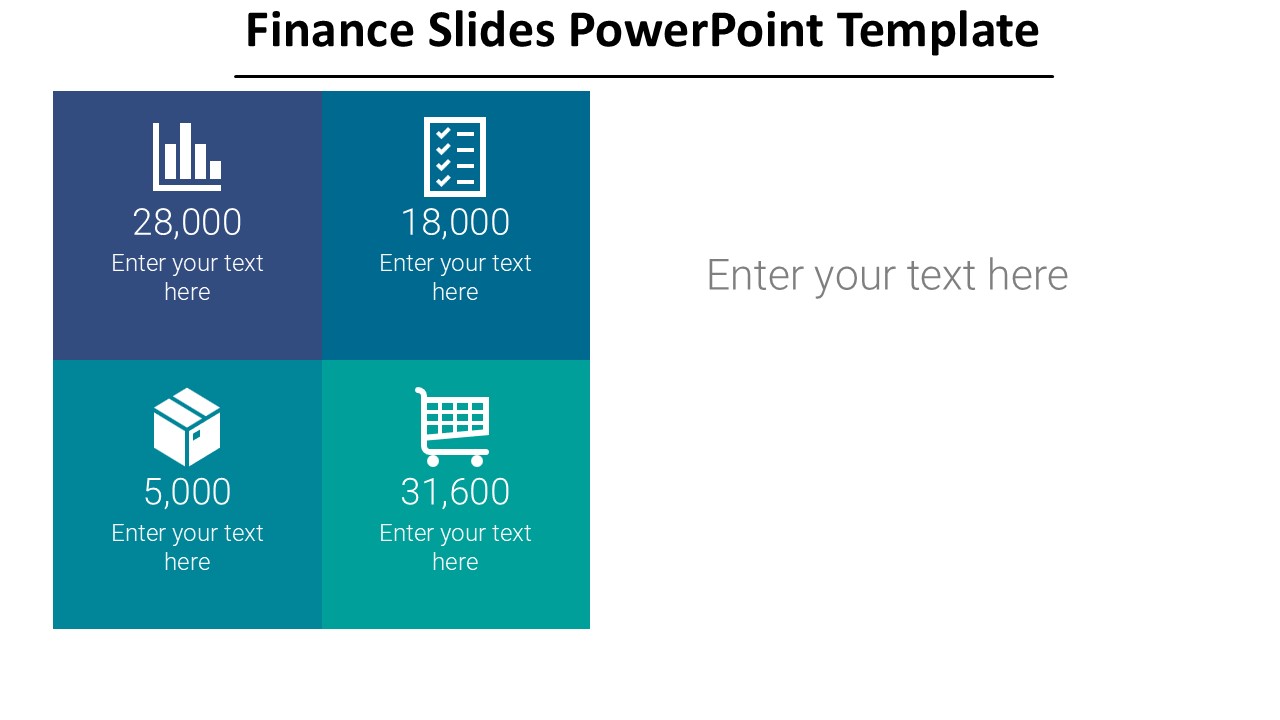
This PowerPoint template includes a variety of slide designs specifically tailored for showcasing key financial metrics and KPIs in a visually engaging way. With sleek and modern designs, this presentation will help you present your financial data in a clear and concise manner, making it easier for your audience to understand and interpret.
Featuring a range of customizable charts, graphs, tables, and diagrams, this Financial Dashboard PowerPoint Presentation allows you to easily input your own data and information to create a personalized and professional-looking presentation. Whether you’re providing an update on financial performance to stakeholders or analyzing financial trends for strategic planning, this template will help you present your data with confidence and clarity.
Key Features:
1. Fully editable templates – Easily customize colors, fonts, and layouts to match your brand and business needs.
2. Ready-to-use charts and graphs – Choose from a variety of pre-designed charts and graphs to visualize your data with just a few clicks.
3. Data-driven diagrams – Create dynamic and interactive presentations by linking charts and graphs to your data sources.
4. Comprehensive financial slides – Includes slides for income statements, balance sheets, cash flow statements, financial ratios, and more.
5. Professional design – Impress your audience with sleek and modern slide layouts that are designed to captivate and engage.
With our Financial Dashboard PowerPoint Presentation, you can save time and effort in creating professional financial presentations that effectively communicate your key financial insights. Download this template today and take your financial reporting to the next level.


Be the first to review “Financial Dashboard PowerPoint Presentation”