Skip to content
    • Log In
    • Register
  • BLOG
  • FAQ
  • ABOUT US
  • CONTACT US
  • PRIVACY POLICY
  • Plans & Pricing
    • Log In
    • Register
SlidevillaSlidevilla

  • Plans & Pricing
  • ALL PRODUCTS
  • Login
  • PowerPoint Templates
    • Agile
    • Business PowerPoint Templates
    • Roadmap
    • Strategy
    • PowerPoint Backgrounds
    • Resume Templates
    • Progressive Roadmap
    • Self Introcution PPT
    • Diversity And Inclusion PPT
    • Roadmap PPT
    • Social Media
    • Kids
    • Idea
    • Health And Fitness
    • Technology
    • Pricing
    • PowerPoint Presentations
    • Slide Deck
  • PowerPoint Diagrams
    • Arrow Diagrams
    • Circular Diagrams
    • Flow Chart Diagrams
    • Funnel Diagrams
    • Process Flow Diagrams
    • Segmented Diagrams
    • Staged Diagrams
  • Power Point Maps
    • Africa
    • Asia
    • South America
    • Central America
    • Europe
    • North America
    • Oceania
    • World Maps & Globes
  • PowerPoint Shapes
    • 3D Shapes for PowerPoint
    • Cartoons
    • Creative
    • Gauges & Meters
    • Recycle
    • Traffic Lights & Signs Gears
  • Data & Charts
    • Bar Chart Presentation
    • Curves and Statistical
    • Pie Charts
    • Dashboards
  • Text & Tables
    • Creative Layouts
    • Comparison PPT Template
    • Comparison Template
  • Login
Home / Shop / PowerPoint Templates
Add to Wishlist

Election Results Breakdown PowerPoint Presentation PPT

Download

Category: PowerPoint Templates
Browse
  • Data & Charts
    • Bar Chart Presentation
    • Curves and Statistical
    • Dashboards
    • Pie Charts
  • Free for All
  • Power Point Maps
    • Africa
    • Asia
    • Central America
    • Europe
    • North America
    • Oceania
    • South America
    • World Maps & Globes
  • Power Point Text & Tables
    • Comparison PPT Template
    • Creative Layouts
  • PowerPoint Diagrams
    • Arrow Diagrams
    • Circular Diagrams
    • Flow Chart Diagrams
    • Funnel Diagrams
    • Process Flow Diagrams
    • Segmented Diagrams
    • Staged Diagrams
  • PowerPoint Presentations
  • PowerPoint Shapes
    • 3D Shapes for PowerPoint
    • Cartoons
    • Creative
    • Gauges & Meters
    • Recycle
    • Traffic Lights & Signs Gears
  • PowerPoint Templates
    • Agile
    • Business PowerPoint Templates
    • Health And Fitness
    • Idea
    • Kids
    • PowerPoint Backgrounds
    • Pricing
    • Resume Templates
    • Roadmap
    • Social Media
    • Strategy
    • Technology
  • Slide Deck
  • Description
  • Reviews (0)

The Election Results Breakdown PowerPoint Presentation PPT is a comprehensive and professional tool for analyzing and presenting election data in a visually appealing manner. This versatile presentation template is perfect for political analysts, news reporters, government officials, and anyone else looking to visualize and communicate election results effectively.

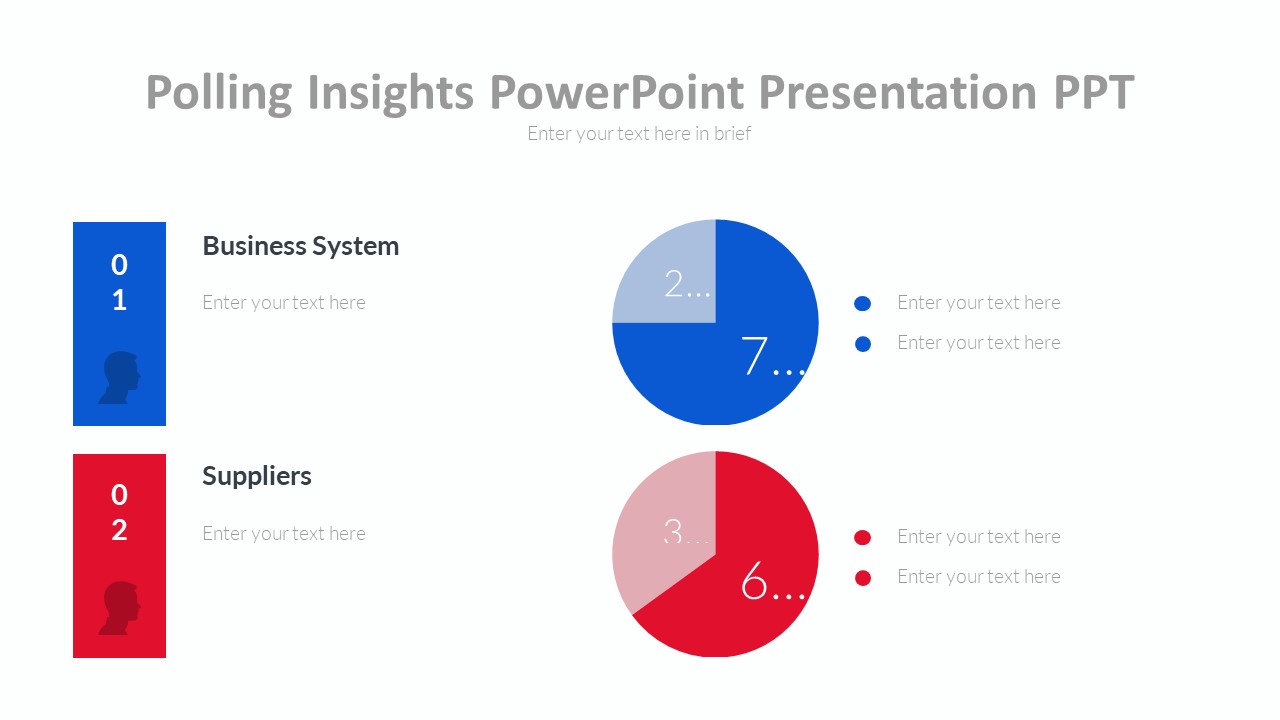
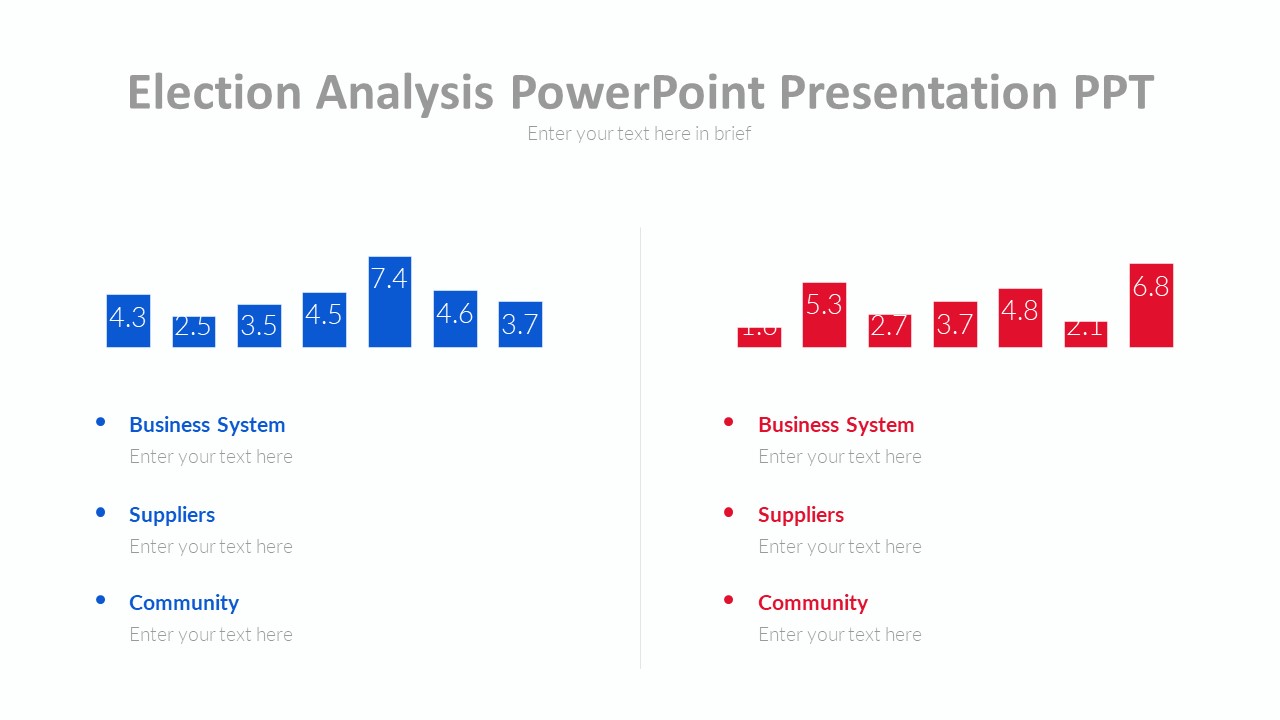
This PowerPoint template includes a range of slide designs that can be easily customized to suit your specific needs. From bar graphs and pie charts to maps and infographics, the Election Results Breakdown PPT has everything you need to break down and interpret election data with ease. The clean and modern design ensures that your audience stays engaged and focused on the information you are presenting.

Whether you are dissecting vote counts, analyzing demographics, or comparing historical data, this presentation template provides the flexibility and versatility to do so effectively. With its user-friendly layout and simple editing features, you can quickly input your own election results and tailor the slides to match your branding or style preferences.

Features:
1. Fully editable templates: Easily customize colors, fonts, and layouts to match your branding or presentation style.
2. Wide variety of slide designs: Choose from a selection of graphs, charts, maps, and infographics to best present your election data.
3. Data visualization tools: Effectively communicate complex election results through visually engaging graphics.
4. Easy to use: User-friendly interface allows for quick and seamless editing of content and design elements.
5. Professional and modern design: Impress your audience with a sleek and polished presentation that conveys professionalism and expertise.

In conclusion, the Election Results Breakdown PowerPoint Presentation PPT is a must-have tool for anyone looking to analyze and communicate election data in a clear and compelling way. With its fully editable templates and user-friendly features, this presentation template will help you create impactful and informative presentations that leave a lasting impression.

Reviews

There are no reviews yet.

Be the first to review “Election Results Breakdown PowerPoint Presentation PPT” Cancel reply

Best Selling
  • Editable Brazil Map Template for PowerPoint
  • columbia ppt template Columbia whole Map for PowerPoint Template
  • Globe pin Map for PowerPoint Template
  • Panama Map for PowerPoint Template
Slides
  • Visualizing Data With Iceberg Graphics PowerPoint Presentation
  • World Map Travel PowerPoint Presentation
  • World Map Arrows PowerPoint Presentation
  • Timeline With Phases PowerPoint Presentation
Featured
  • Go to Market Strategy template Go to Market Strategy template
    Rated 4.40 out of 5
    £5.00
  • Conference agenda powerpoint template slide Conference agenda powerpoint template slide
  • Chemical Industry shapes Chemical Industry shapes
  • Organization Chart PowerPoint Template Organization Chart PowerPoint Template
    Rated 4.69 out of 5
Top Rated
  • Gadgets Comparison Table for PowerPoint Template
    Rated 5.00 out of 5
  • Resignation letter template slide for powerpoint Resignation letter template slide for powerpoint
    Rated 5.00 out of 5
  • Current State Vs Future State Infographics PowerPoint Template Current State Vs Future State Infographics PowerPoint Template
    Rated 5.00 out of 5
  • Recruitment and Selection Policy PowerPoint Presentation Recruitment and Selection Policy PowerPoint Presentation
    Rated 5.00 out of 5
Our Clinets
COMPANY
  • BLOG
  • FAQ
  • ABOUT US
  • CONTACT US
  • PRIVACY POLICY
Product categories
  • Data & Charts
    • Bar Chart Presentation
    • Curves and Statistical
    • Dashboards
    • Pie Charts
  • Free for All
  • Power Point Maps
    • Africa
    • Asia
    • Central America
    • Europe
    • North America
    • Oceania
    • South America
    • World Maps & Globes
  • Power Point Text & Tables
    • Comparison PPT Template
    • Creative Layouts
  • PowerPoint Diagrams
    • Arrow Diagrams
    • Circular Diagrams
    • Flow Chart Diagrams
    • Funnel Diagrams
    • Process Flow Diagrams
    • Segmented Diagrams
    • Staged Diagrams
  • PowerPoint Presentations
  • PowerPoint Shapes
    • 3D Shapes for PowerPoint
    • Cartoons
    • Creative
    • Gauges & Meters
    • Recycle
    • Traffic Lights & Signs Gears
  • PowerPoint Templates
    • Agile
    • Business PowerPoint Templates
    • Health And Fitness
    • Idea
    • Kids
    • PowerPoint Backgrounds
    • Pricing
    • Resume Templates
    • Roadmap
    • Social Media
    • Strategy
    • Technology
  • Slide Deck
Recent Posts
  • Best Acknowledgment Samples and examples
  • 23
    Jul
    Você sabe que a roda de cores simples pode chamar a atenção?
  • Do you know the simple color wheel can catch the eye?
Copyright 2025 © SlideVilla.Com
  • Login
  • Sign Up
Forgot Password?
Lost your password? Please enter your username or email address. You will receive a link to create a new password via email.
Connect with:
Google

Login

Lost your password?

Register

Your personal data will be used to support your experience throughout this website, to manage access to your account, and for other purposes described in our privacy policy.