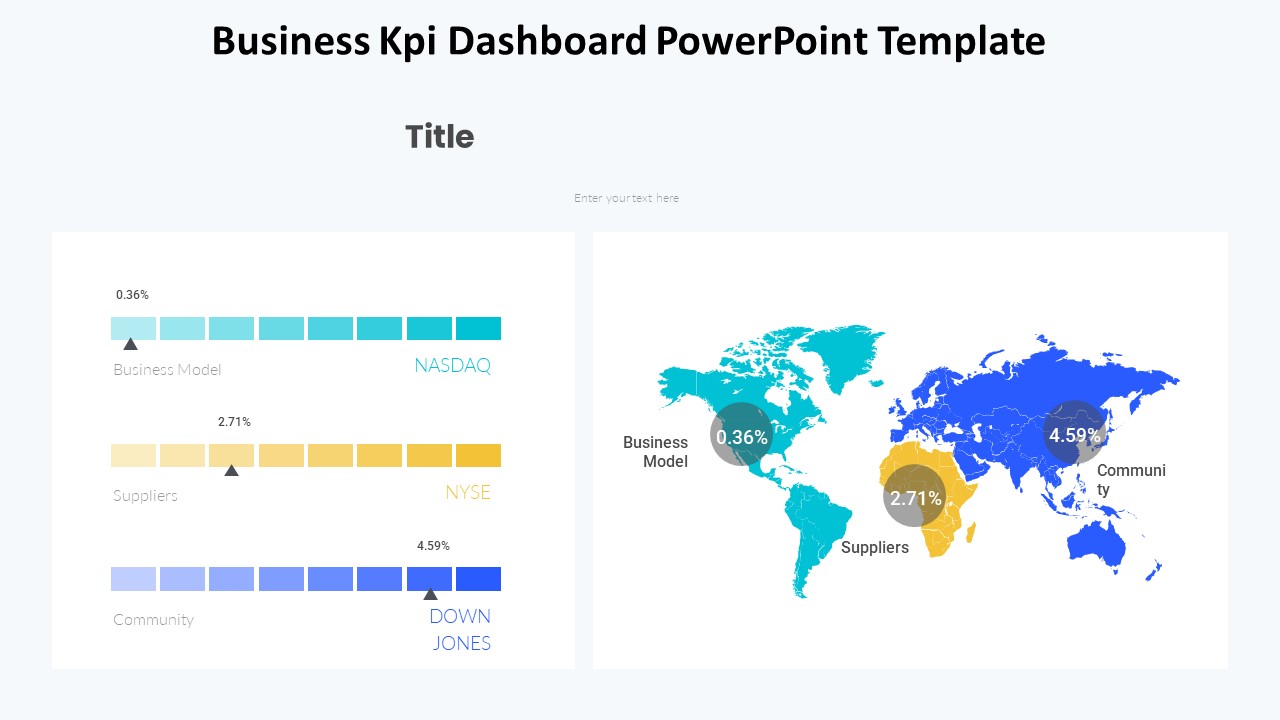
The DevOps KPI Metrics Dashboard PowerPoint Template is a powerful tool designed to help businesses monitor and analyze key performance indicators related to their DevOps processes. This template provides a comprehensive set of slides that can be easily customized to suit the specific needs of your organization.
With this template, you can create professional-looking dashboards that display important metrics such as deployment frequency, lead time, change failure rate, and mean time to recovery. These metrics are crucial for understanding the effectiveness of your DevOps practices and identifying areas for improvement.
The DevOps KPI Metrics Dashboard PowerPoint Template features a modern and clean design, making it easy to present complex data in a clear and visually appealing way. Whether you are reporting to stakeholders, management, or team members, this template will help you communicate your DevOps performance metrics effectively.
Key Features:
1. Fully Editable Slides: Easily customize the slides to fit your specific metrics and branding requirements.
2. Data Visualization: Present your DevOps KPIs in easy-to-understand charts, graphs, and tables.
3. Professional Design: Impress your audience with a sleek and modern dashboard layout.
4. Easy to Use: Simply plug in your data and start presenting – no design skills required.
5. Flexible and Versatile: Use this template for reporting, monitoring, or planning your DevOps initiatives.
Overall, the DevOps KPI Metrics Dashboard PowerPoint Template is a valuable resource for any organization looking to improve their DevOps performance and drive continuous improvement. With its user-friendly design and customizable features, this template will help you take your DevOps reporting to the next level.


Be the first to review “Devops Kpi Metrics Dashboard PowerPoint Template”