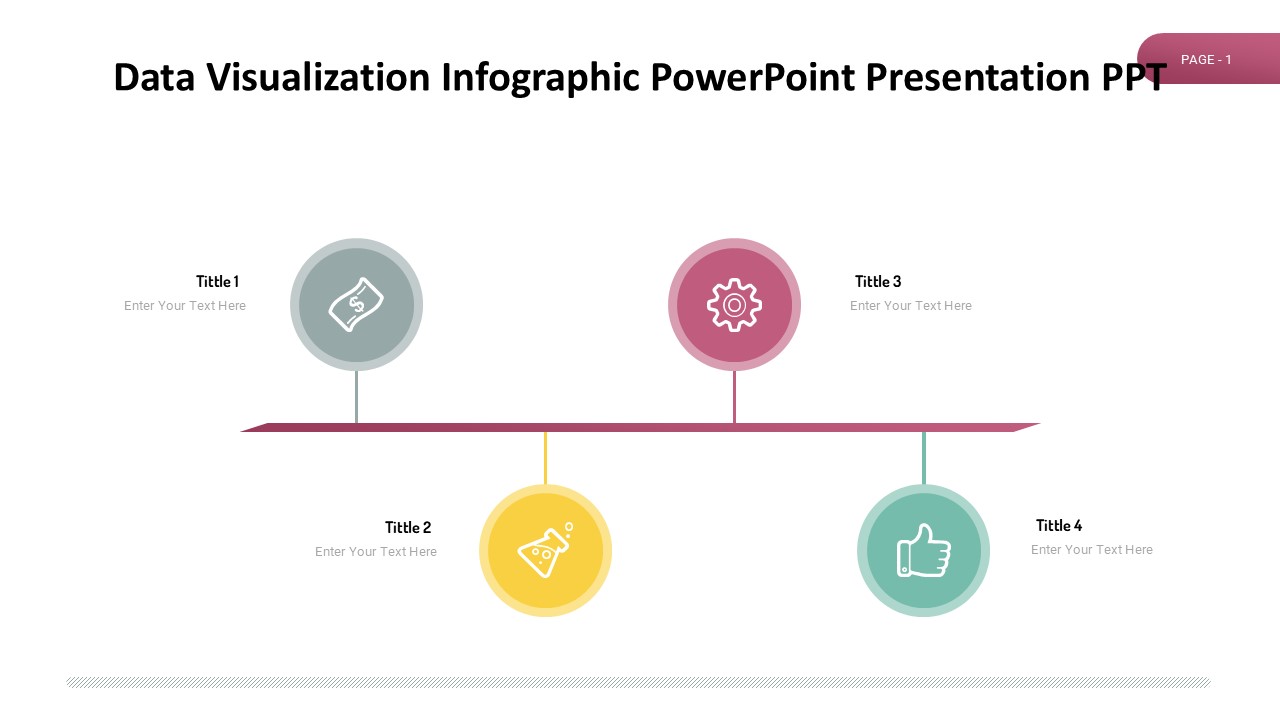
Are you looking to present complex data in a visually appealing way? Our Data Visualization Infographic PowerPoint Presentation PPT is the perfect solution for you. This professionally designed template is ideal for creating impactful presentations that effectively communicate your data insights.
This Data Visualization Infographic PowerPoint Presentation PPT includes a variety of infographic elements such as charts, graphs, diagrams, and icons that can help you illustrate your data in a clear and engaging manner. Whether you are presenting sales trends, marketing analysis, financial reports, or any other type of data, this template has everything you need to make your presentation stand out.
With easy-to-edit slides, you can customize the colors, fonts, and content to suit your branding and messaging. This template is designed to save you time and effort, allowing you to focus on crafting a compelling narrative around your data.
Features:
1. Fully Editable Templates: Easily customize the colors, fonts, and content to match your brand or presentation theme.
2. Infographic Elements: Includes a wide variety of charts, graphs, diagrams, and icons to help you visualize your data effectively.
3. Professional Design: Professionally designed slides to give your presentation a polished and modern look.
4. Easy-to-Use: User-friendly interface that allows you to quickly create stunning data visualizations without any design experience.
5. Versatile: Suitable for all types of data presentations, from sales reports to academic research findings.
In conclusion, our Data Visualization Infographic PowerPoint Presentation PPT is a versatile and user-friendly template that will help you create engaging and impactful data presentations. Whether you are a business professional, educator, or researcher, this template will make your data stand out and leave a lasting impression on your audience.


Be the first to review “Data Visualization Infographic PowerPoint Presentation PPT”