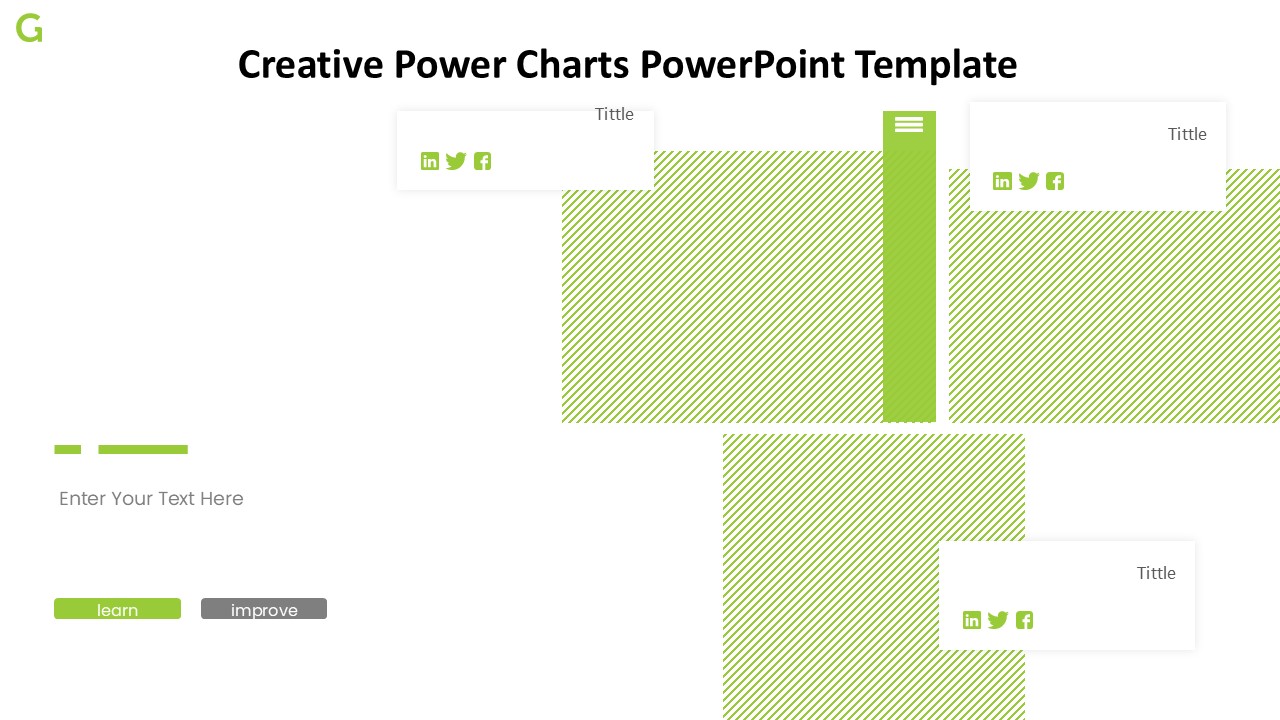
The Creative Power Charts PowerPoint Template is a versatile and dynamic presentation tool designed to help you captivate your audience and convey complex data in a visually engaging manner. With a variety of customizable charts and graphs, this template is perfect for business presentations, reports, and academic projects.
This template features a modern and sleek design with vibrant colors and eye-catching visuals that will keep your audience interested and engaged. Whether you need to showcase sales figures, market trends, or project timelines, the Creative Power Charts PowerPoint Template has everything you need to create professional-looking presentations that leave a lasting impression.
Key Features:
– Fully editable charts and graphs: Easily customize the data points, labels, colors, and fonts to suit your specific needs and branding requirements.
– Wide range of chart types: Choose from bar charts, line graphs, pie charts, and more to visualize your data in the most effective way.
– Easy to use: Simply drag and drop the charts into your presentation and input your data to create professional-looking slides in minutes.
– Fully compatible: This template is compatible with Microsoft PowerPoint, Google Slides, and Apple Keynote, making it easy to use on any platform.
– Professional design: The modern and sleek design of this template will help you stand out and make a lasting impression on your audience.
Whether you’re a business professional, educator, or student, the Creative Power Charts PowerPoint Template is a valuable tool for creating impactful presentations that effectively communicate complex data in a visually appealing way. Upgrade your presentations and take your storytelling to the next level with this powerful and versatile template.


Be the first to review “Creative Power Charts PowerPoint Template”