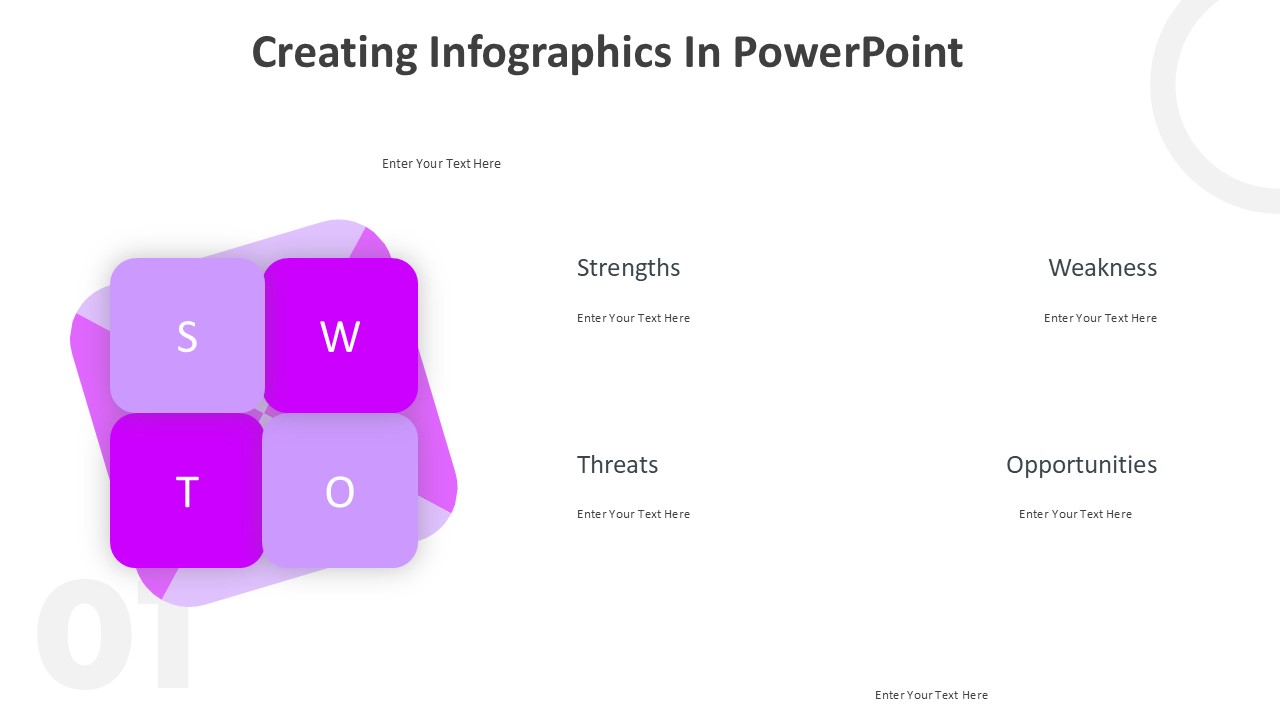
Create Cycle Diagram in PowerPoint is a powerful tool that allows users to visually represent a process or workflow in a circular format. This feature-rich application offers a wide range of customizable options, making it easy for users to design professional-looking diagrams with ease.
With Create Cycle Diagram in PowerPoint, users can choose from a variety of pre-designed templates or start from scratch to build a diagram that suits their specific needs. The intuitive interface and drag-and-drop functionality make it simple to add, remove, or rearrange elements within the diagram, allowing for quick and effortless customization.
One of the key features of Create Cycle Diagram in PowerPoint is its fully editable templates. These templates are designed to be easily customizable, allowing users to change colors, fonts, sizes, and more to match their branding or presentation style. This flexibility ensures that every diagram created with Create Cycle Diagram in PowerPoint is unique and tailored to the user’s preferences.
In addition to its customization options, Create Cycle Diagram in PowerPoint also offers a range of other features to enhance the user experience. These include the ability to add animated effects, icons, and images to the diagram, as well as options for exporting the diagram to other formats such as PDF or image files. Users can also collaborate with others in real-time by sharing their diagrams online or presenting them directly from PowerPoint.
Overall, Create Cycle Diagram in PowerPoint is a versatile and user-friendly tool that makes it easy to create professional-looking diagrams for any presentation or project. Its fully editable templates ensure that users can design diagrams that are both visually appealing and effective, helping them to communicate their ideas clearly and concisely.


Be the first to review “Create Cycle Diagram In PowerPoint”