Are you looking to gain a competitive edge in your industry? Our Competitive Analysis Charts PowerPoint Presentation is the perfect tool to help you analyze your competition and make strategic decisions to outperform them.
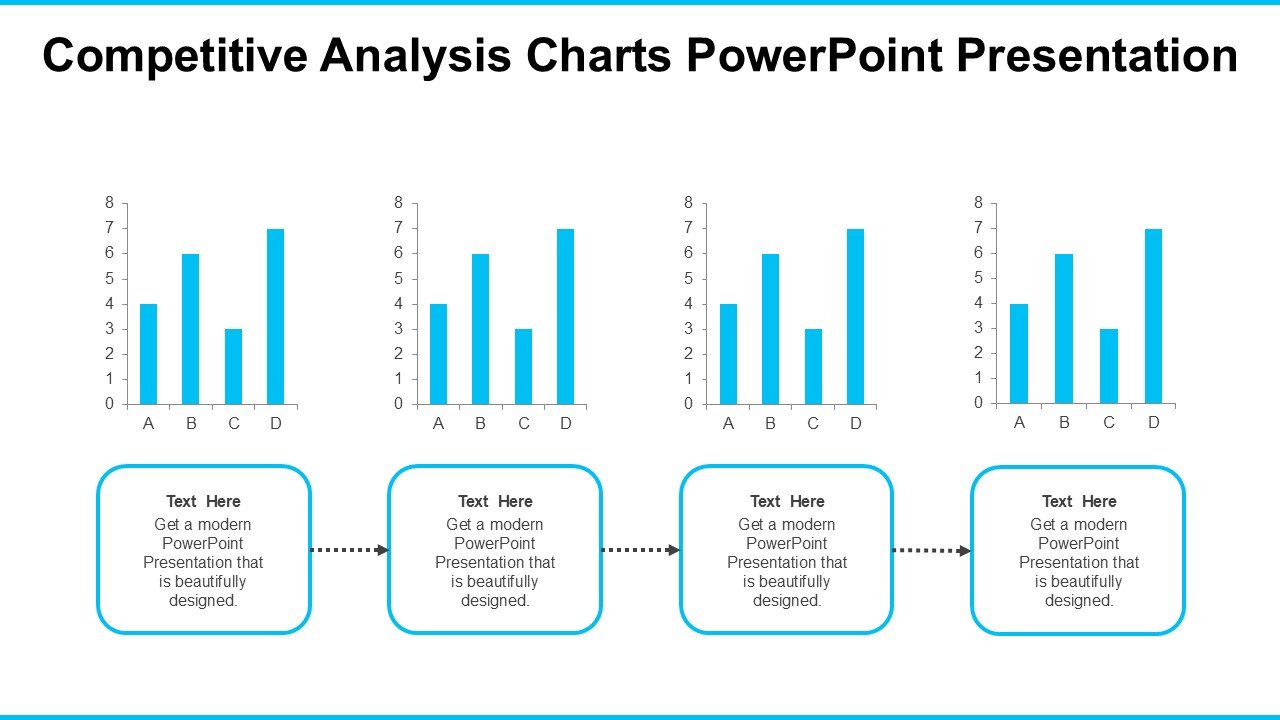
This detailed and professional presentation template includes a variety of charts and graphs designed specifically for competitive analysis. With these visuals, you can easily compare your company’s performance with that of your competitors across various key metrics such as market share, revenue growth, customer satisfaction, and more.
The Competitive Analysis Charts PowerPoint Presentation is fully customizable, allowing you to edit the colors, fonts, and data points to suit your specific needs. Whether you’re presenting to executives, investors, or team members, this template will help you clearly communicate your findings and recommendations for staying ahead of the competition.
Key Features:
1. Easy to Edit: The slides are fully editable, allowing you to customize them to match your brand and data.
2. Professional Designs: The charts and graphs are designed to convey information clearly and effectively.
3. Data-Driven: Easily input your data into the charts and graphs to visualize your competitive analysis metrics.
4. Versatile Usage: Suitable for various industries and business sizes, making it a versatile tool for any organization.
5. Time-Saving: Save time on creating visuals from scratch and focus on analyzing and strategizing based on the data presented.
With our Competitive Analysis Charts PowerPoint Presentation, you’ll have all the tools you need to conduct a thorough analysis of your competition and identify opportunities for growth and success. Stay ahead of the curve with this powerful and customizable template.


Be the first to review “Competitive Analysis Charts PowerPoint Presentation”