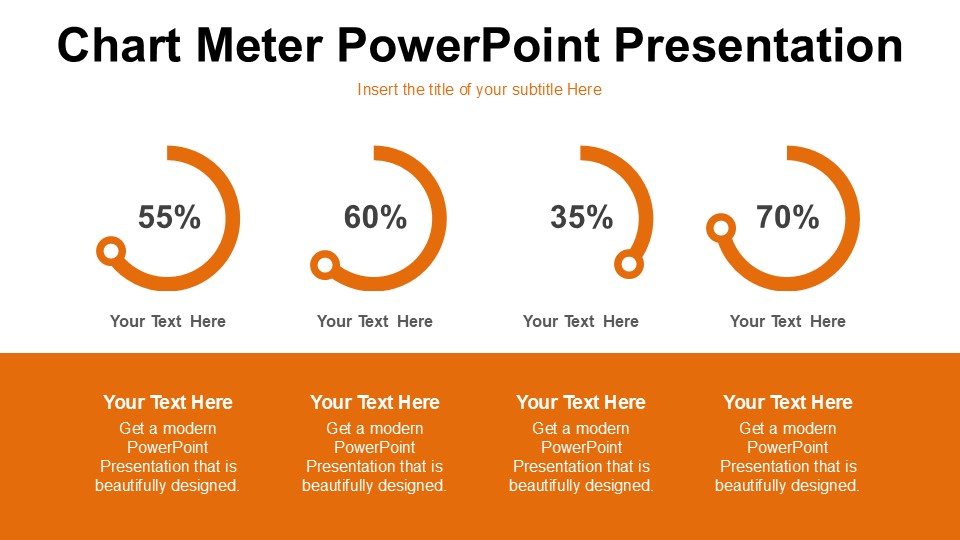
The Chart Meter PowerPoint Presentation is a versatile and professional tool that allows users to create visually appealing charts and graphs for their presentations. With a sleek and modern design, this presentation template is perfect for businesses, educators, and professionals looking to showcase their data in a clear and engaging way.
This PowerPoint presentation includes a variety of chart meters, from pie charts to bar graphs, line graphs, and more. Each template is fully customizable, allowing users to easily edit colors, fonts, and data points to suit their specific needs. Whether you’re presenting sales figures, project timelines, or survey results, the Chart Meter PowerPoint Presentation has everything you need to create impactful and informative slides.
Key Features:
1. Fully Editable Templates: Customize colors, fonts, and data points to create a tailored look for your presentation.
2. Wide Variety of Chart Meters: Choose from a selection of chart meters, including pie charts, bar graphs, line graphs, and more.
3. Modern and Professional Design: Impress your audience with sleek and visually appealing charts and graphs.
4. Easy to Use: Simply insert your data and customize the template to create polished slides in minutes.
5. Versatile Applications: Perfect for business presentations, academic lectures, project updates, and more.
Whether you’re a seasoned presenter or new to using PowerPoint, the Chart Meter PowerPoint Presentation is a valuable tool that will help you communicate your data effectively and professionally. Upgrade your presentations with this dynamic and user-friendly template today.


Be the first to review “Chart Meter PowerPoint Presentation”