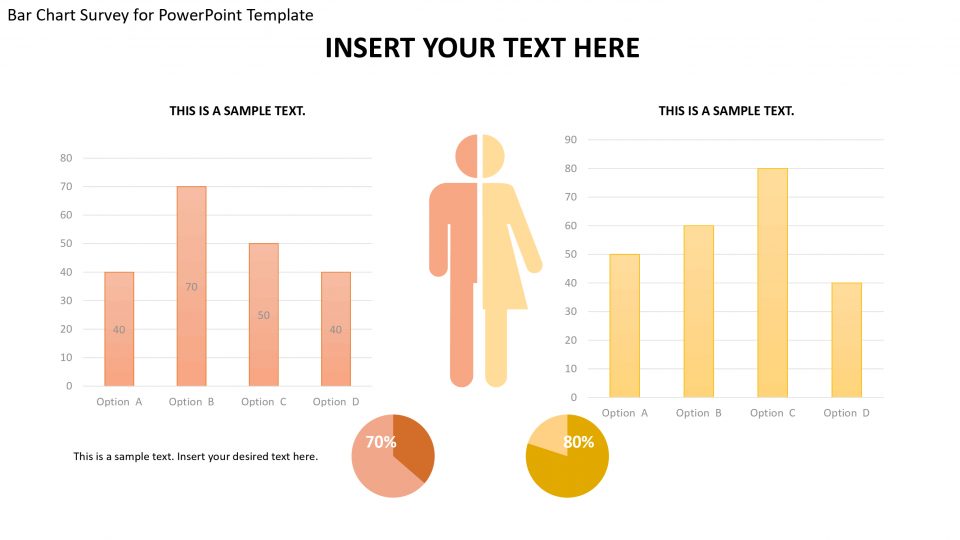
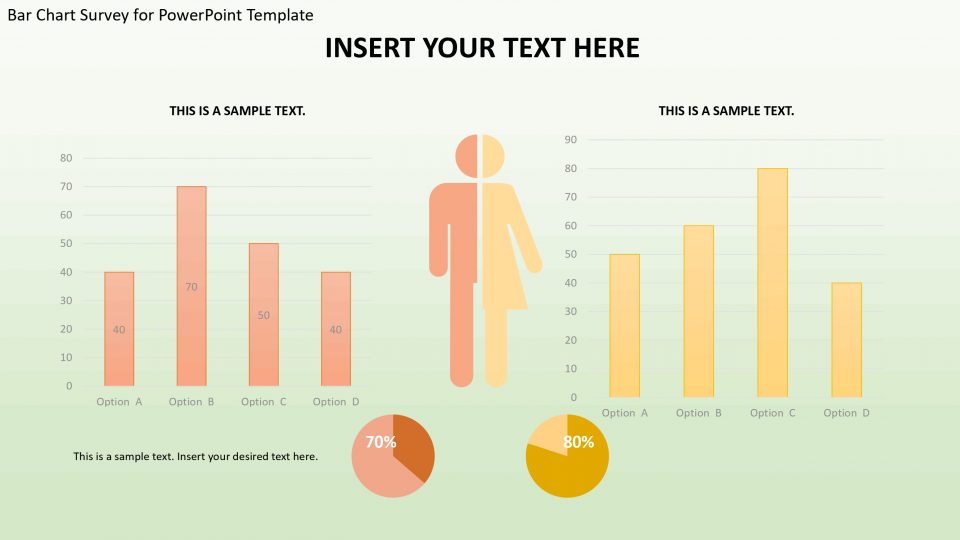
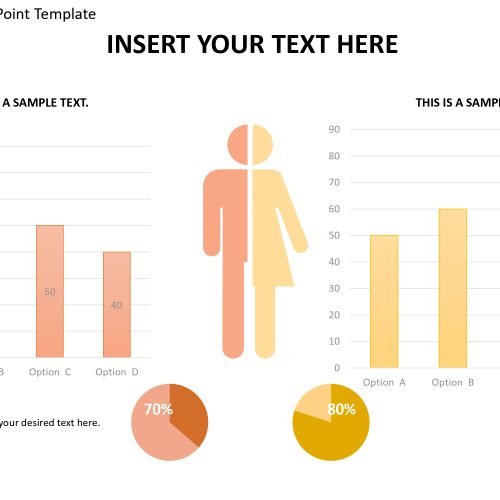
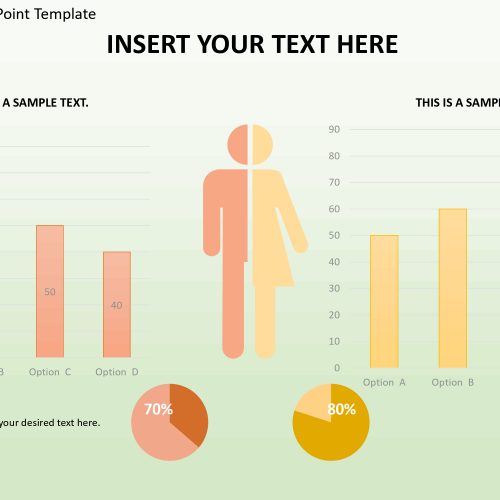
The bar chart survey powerpoint template is a successful choice when expected to exhibit the key execution markers to investors or supervisors. A few options are accessible to show the measurable information. Be that as it may, Column graph layouts are the most usually utilized factual language to demonstrate the recurrence circulation of information. These formats utilize round and hollow shapes to show each straight out information.
A section graph PowerPoint layout is the most widely recognized and well known diagram type, that can be made in a PowerPoint. The explanation behind the ubiquity is it pursues the human reasoning. The taller the chart, more the benefit or deals. It’s a cool and adaptable diagram made utilizing PowerPoint objects. Unmitigated information can be spoken to in Y-Axis or flat Axis, and the in X-Axis or vertical hub esteems are spoken to. In our 3D section diagram layout, every class has three particular and non-symmetrical bars, which can be utilized for information examination. Each bar is spoken to utilizing various hues. At the base of the layout is the correlation table where the moderator can include the information of every classification. Contiguous the format is discrete content zones for every classification. The moderator can utilize it to include notes.
Features:
- Completely editable in terms of shape, color, size and text
- This template has a built in color theme which is unaffected by copy-pasting
- Includes an icon family with 135 unique completely editable icons
- Drag and drop image placeholder
- Completely editable (using spreadsheet) data-driven charts for displaying statistics
- Completely editable vector graphics
Supports
Microsoft PowerPoint 2010, 2011, 2013, 2016
MacOffice 2016, MacOffice 365


Be the first to review “Bar Chart Survey for PowerPoint Template”