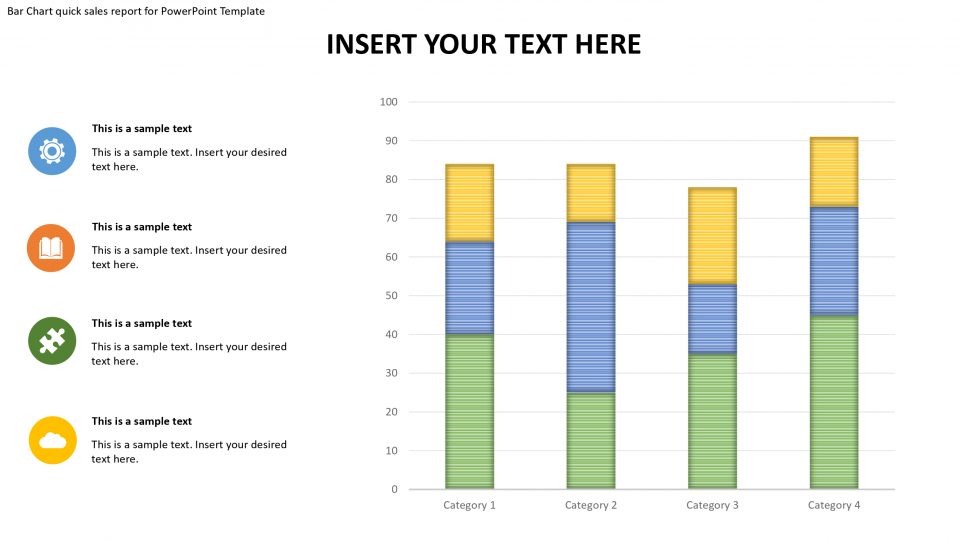
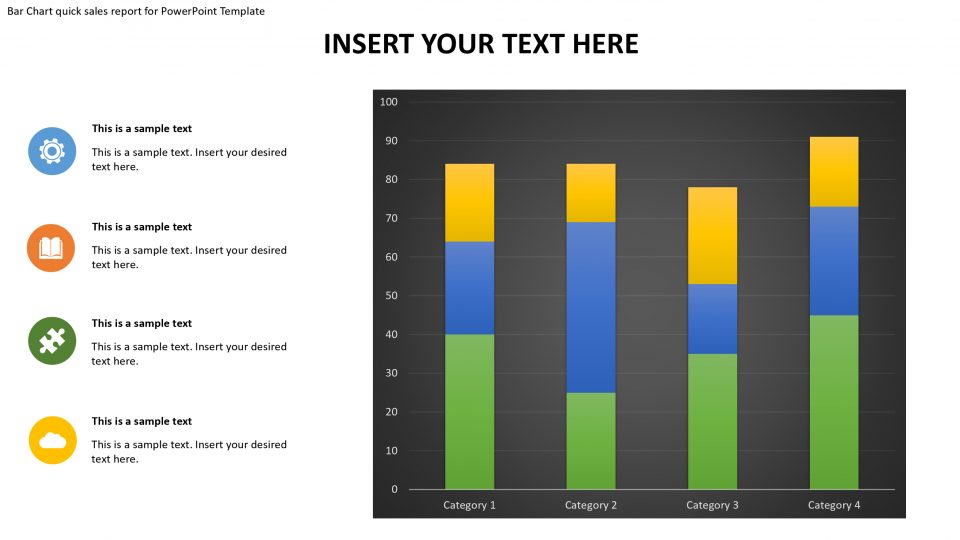
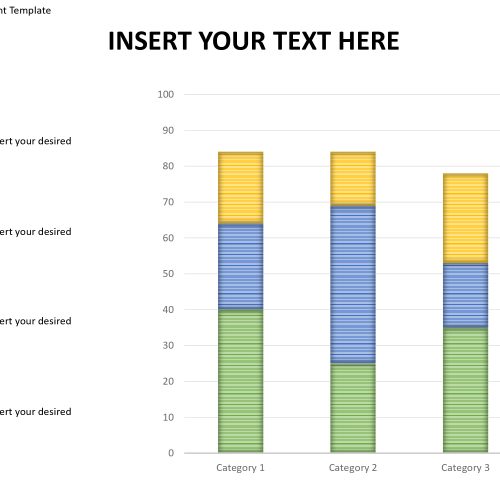
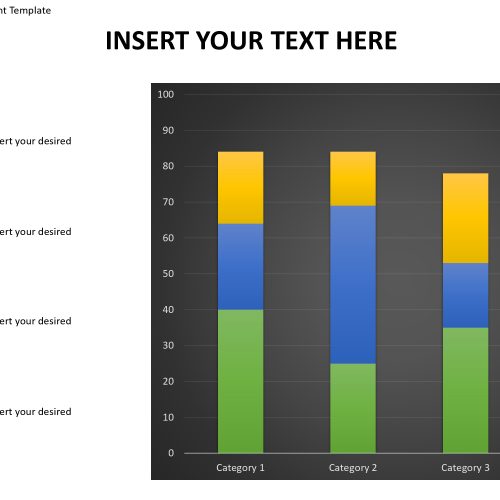
The bar chart quick sales report for powerpoint template helps to get the information you may have inquired about scarcely. In this way, the information ought to be accentuated utilizing dazzling designs. Spare your time and exertion with our specially custom fitted bar diagram layout. Structured in an advanced format, the layout highlights imaginative and bright outlines which can be gotten to convey various introduction settings. Bar outlines are said as the most well-known method for condensing downright information. Each bar in a format speaks to a specific class. The sizes of the bars may differ dependent on the estimation of the factual information.
Our information bar graph PowerPoint layout is a perfect systematic apparatus to display your business information. The format highlights six bars diagram; each bar is sponsored with a slope bar, which makes it simple to delineate the distinction between the most astounding and the least estimation of the information. At the base of the layout is six circle shapes, hued in a similar shading as of the bars. The moderator can speak to or name each chart. Adjoining the diagram is the infographic symbols. The moderator can outline data on each bar. The brilliant layout will rapidly invigorate the crowd center over the point. The brilliant shading palette makes the format all the more satisfying.
Our reference diagram outline is an advantageous mode for exhibiting the complex factual information graphically. Through which, the group of spectators can in a split second snatch the possibility of the point. The structured presentation format is planned utilizing PowerPoint objects, which makes the layout completely adaptable. It empowers the moderator to change shading, resize, alter the components of the layout which makes components effectively discernable.
Features:
- Completely editable in terms of shape, color, size and text
- This template has a built in color theme which is unaffected by copy-pasting
- Includes an icon family with 135 unique completely editable icons
- Drag and drop image placeholder
- Completely editable (using spreadsheet) data-driven charts for displaying statistics
- Completely editable vector graphics
Supports
Microsoft PowerPoint 2010, 2011, 2013, 2016
MacOffice 2016, MacOffice 365


Be the first to review “Bar Chart quick sales report for PowerPoint Template”