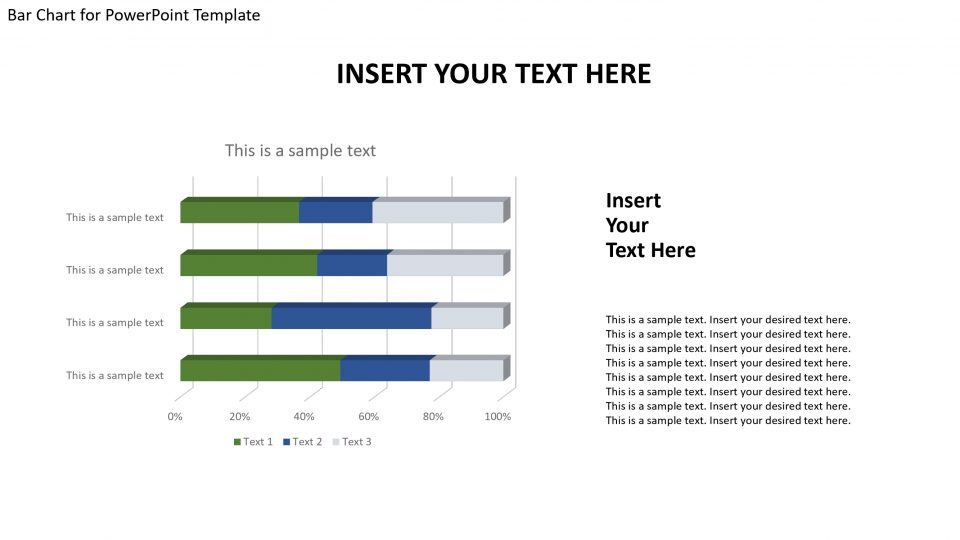
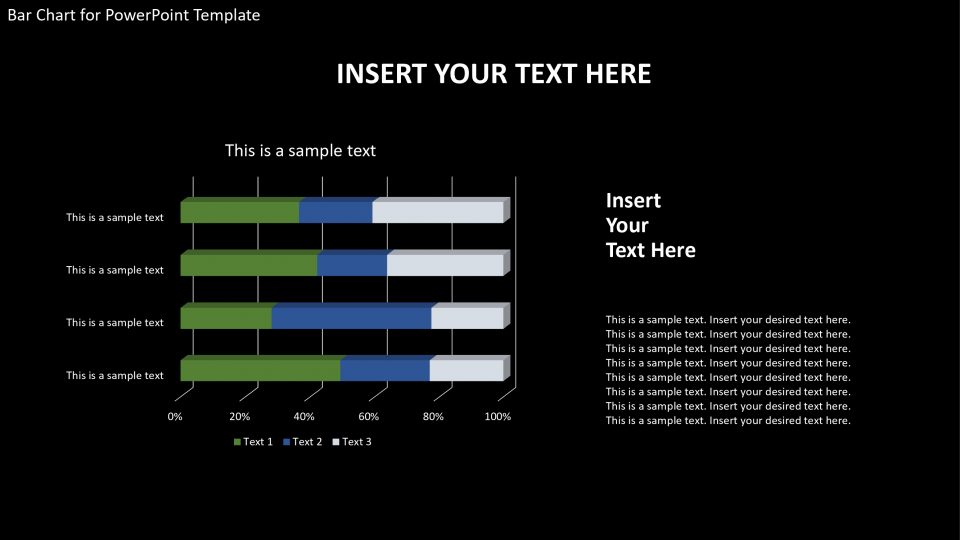
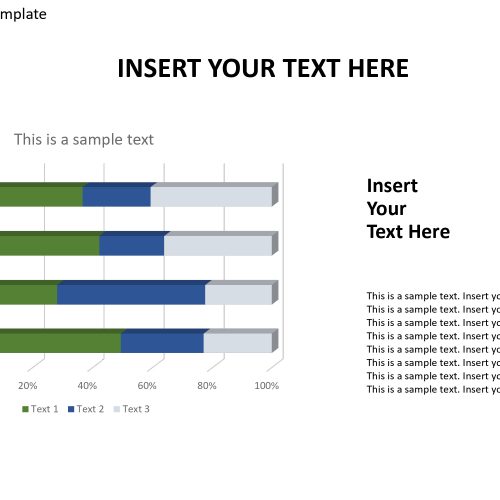
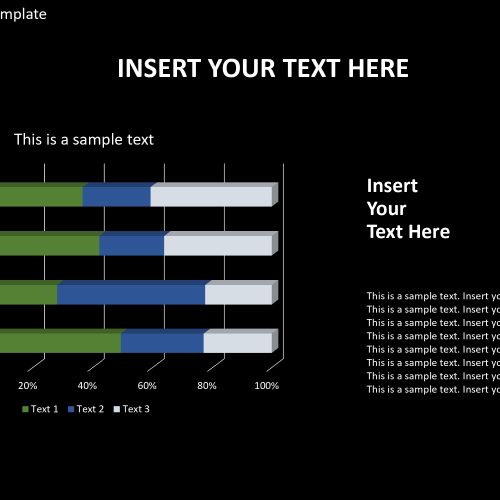
The Bar chart powerpoint template is a design used for displaying data in a statistical format. The bars are presented in a horizontal way, in rows four.
This bar chart template design can be utilized to make impressive introductions in PowerPoint and present information while keeping up the observers centered in your exhibition. This can be altered to make deals introductions. The particular structure makes them emerge against the highly contrasting foundation. The illustrations are intended to eye-getting. They present an expert plan that is perfect for formal business and research introductions.
Utilizing the bar diagram PowerPoint format, diverse measurable information can be exhibited. It is perfect for the introduction of either deals projections or chronicled deals information. This layout can be utilized to analyze different monetary data, for the goals of settling on significant business decisions. The clients can alter the highlights of this PowerPoint format, change shading blend reshape the bars, are a portion of the few.
bar diagram layout is regularly utilized when you have to speak to information or make correlations. It has X and Y pivot, while one hub demonstrates the classes, different demonstrates the worth related to it. Bar Chart are generally rectangular bars on a diagram showed either on a level plane or vertically and the length of the bars differ contingent upon the qualities. This gathering bar diagram test has multiple bars which show examination among more than one class
Features:
- Completely editable in terms of shape, color, size and text
- This template has a built in color theme which is unaffected by copy-pasting
- Includes an icon family with 135 unique completely editable icons
- Drag and drop image placeholder
- Completely editable (using spreadsheet) data-driven charts for displaying statistics
- Completely editable vector graphics
Supports
Microsoft PowerPoint 2010, 2011, 2013, 2016
MacOffice 2016, MacOffice 365


Be the first to review “Bar Chart for PowerPoint Template”