Skip to content
    • Log In
    • Register
  • BLOG
  • FAQ
  • ABOUT US
  • CONTACT US
  • PRIVACY POLICY
  • Plans & Pricing
    • Log In
    • Register
SlidevillaSlidevilla

  • Plans & Pricing
  • ALL PRODUCTS
  • Login
  • PowerPoint Templates
    • Agile
    • Business PowerPoint Templates
    • Roadmap
    • Strategy
    • PowerPoint Backgrounds
    • Resume Templates
    • Progressive Roadmap
    • Self Introcution PPT
    • Diversity And Inclusion PPT
    • Roadmap PPT
    • Social Media
    • Kids
    • Idea
    • Health And Fitness
    • Technology
    • Pricing
    • PowerPoint Presentations
    • Slide Deck
  • PowerPoint Diagrams
    • Arrow Diagrams
    • Circular Diagrams
    • Flow Chart Diagrams
    • Funnel Diagrams
    • Process Flow Diagrams
    • Segmented Diagrams
    • Staged Diagrams
  • Power Point Maps
    • Africa
    • Asia
    • South America
    • Central America
    • Europe
    • North America
    • Oceania
    • World Maps & Globes
  • PowerPoint Shapes
    • 3D Shapes for PowerPoint
    • Cartoons
    • Creative
    • Gauges & Meters
    • Recycle
    • Traffic Lights & Signs Gears
  • Data & Charts
    • Bar Chart Presentation
    • Curves and Statistical
    • Pie Charts
    • Dashboards
  • Text & Tables
    • Creative Layouts
    • Comparison PPT Template
    • Comparison Template
  • Login
Home / Shop / Data & Charts / Bar Chart Presentation
Add to Wishlist

Bar Chart Error Report for PowerPoint Template

Download

Categories: Bar Chart Presentation, Business PowerPoint Templates, Data & Charts, PowerPoint Templates, Staged Diagrams Tags: bar chart, bar chart template, bar charts, business charts, clip art, clustered bar chart, construction schedule bar chart template, customize chart, d3 bar chart, error report template, flat chart, flow chart template, organizational chart template, stacked bar chart
Browse
  • Data & Charts
    • Bar Chart Presentation
    • Curves and Statistical
    • Dashboards
    • Pie Charts
  • Free for All
  • Power Point Maps
    • Africa
    • Asia
    • Central America
    • Europe
    • North America
    • Oceania
    • South America
    • World Maps & Globes
  • Power Point Text & Tables
    • Comparison PPT Template
    • Creative Layouts
  • PowerPoint Diagrams
    • Arrow Diagrams
    • Circular Diagrams
    • Flow Chart Diagrams
    • Funnel Diagrams
    • Process Flow Diagrams
    • Segmented Diagrams
    • Staged Diagrams
  • PowerPoint Presentations
  • PowerPoint Shapes
    • 3D Shapes for PowerPoint
    • Cartoons
    • Creative
    • Gauges & Meters
    • Recycle
    • Traffic Lights & Signs Gears
  • PowerPoint Templates
    • Agile
    • Business PowerPoint Templates
    • Health And Fitness
    • Idea
    • Kids
    • PowerPoint Backgrounds
    • Pricing
    • Resume Templates
    • Roadmap
    • Social Media
    • Strategy
    • Technology
  • Slide Deck
  • Description
  • Reviews (0)

The bar chart error report PowerPoint template is used to explain business presentations, and trends. It is used for explaining complex data, and representing the data with accurate percentile that will aid easy understanding. This template is best used in organizations that have departments or units, to show how well each department is fairing and/or their contribution to the growth of the organization. It can also be used to explain a business strategy and processes involved and how complete each stage is in percentile.

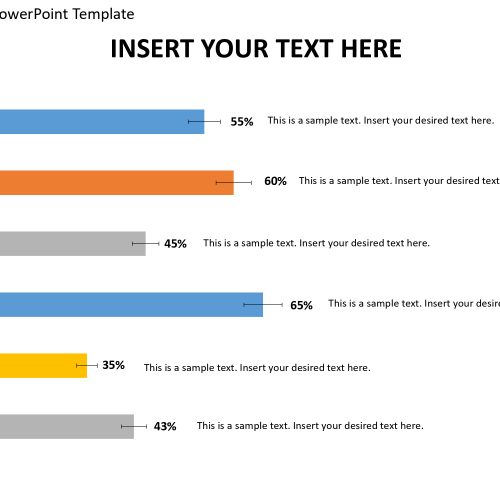
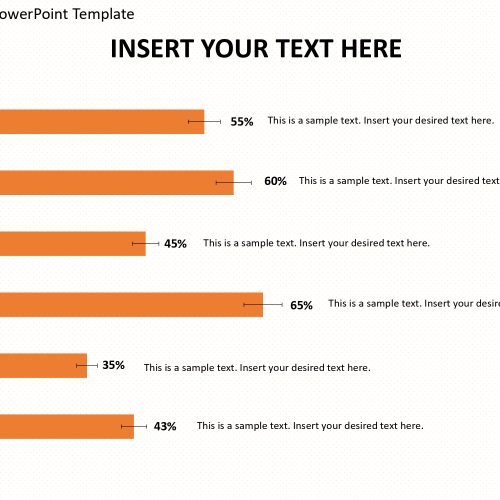
It is used as a singular report presentation. The horizontal bars are editable, and the colors of the bars can be edited to taste and texts can be put in the text bars, the percentage represented by each bar is dependent on the length of the bar. That is if it wants to show the strength of departments in an organization, the longer the bar, the higher the percentage, the shorter the bar, the lesser the percentage. It has text bars beside each bar and a column for years on the x-axis. It is easy to use and understand, and can be modified without altering the image resolution.

Features:

  • Completely editable in terms of shape, color, size and text
  • This template has a built in color theme which is unaffected by copy-pasting
  • Includes an icon family with 135 unique completely editable icons
  • Drag and drop image placeholder
  • Completely editable (using spreadsheet) data-driven charts for displaying statistics
  • Completely editable vector graphics

Supports
Microsoft PowerPoint 2010, 2011, 2013, 2016
MacOffice 2016, MacOffice 365

Reviews

There are no reviews yet.

Be the first to review “Bar Chart Error Report for PowerPoint Template” Cancel reply

Best Selling
  • Editable Brazil Map Template for PowerPoint
  • Curved Road For PowerPoint Template
  • Straight Road PowerPoint Template
  • Road to Visionary Achievement PowerPoint Presentation PPT
Slides
  • Your Role Responsibilities and Expectations PowerPoint Presentation
  • Wellness Programs Taking Care of Yourself PowerPoint Presentation
  • Your First Project Getting Started PowerPoint Presentation
  • What is Information Technology PowerPoint Template PowerPoint Presentation
Featured
  • Go to Market Strategy template Go to Market Strategy template
    Rated 4.40 out of 5
    £5.00
  • Business process and achievement template Business process and achievement template
    Rated 4.30 out of 5
  • Timeline for sales promotion Powerpoint template Timeline for sales promotion Powerpoint template
    Rated 4.20 out of 5
  • 5 step vertical banner timeline PowerPoint template 5 step vertical banner timeline PowerPoint template
    Rated 4.50 out of 5
Top Rated
  • 4 Columns Animated Greek Temple 3D PowerPoint Template 4 Columns Animated Greek Temple 3D PowerPoint Template
    Rated 5.00 out of 5
  • Swot analysis template powerpoint Swot analysis template powerpoint
    Rated 5.00 out of 5
  • Creative Roadmap PowerPoint Template Creative Roadmap PowerPoint Template
    Rated 5.00 out of 5
  • Architect Resume Template
    Rated 5.00 out of 5
Our Clinets
COMPANY
  • BLOG
  • FAQ
  • ABOUT US
  • CONTACT US
  • PRIVACY POLICY
Product categories
  • Data & Charts
    • Bar Chart Presentation
    • Curves and Statistical
    • Dashboards
    • Pie Charts
  • Free for All
  • Power Point Maps
    • Africa
    • Asia
    • Central America
    • Europe
    • North America
    • Oceania
    • South America
    • World Maps & Globes
  • Power Point Text & Tables
    • Comparison PPT Template
    • Creative Layouts
  • PowerPoint Diagrams
    • Arrow Diagrams
    • Circular Diagrams
    • Flow Chart Diagrams
    • Funnel Diagrams
    • Process Flow Diagrams
    • Segmented Diagrams
    • Staged Diagrams
  • PowerPoint Presentations
  • PowerPoint Shapes
    • 3D Shapes for PowerPoint
    • Cartoons
    • Creative
    • Gauges & Meters
    • Recycle
    • Traffic Lights & Signs Gears
  • PowerPoint Templates
    • Agile
    • Business PowerPoint Templates
    • Health And Fitness
    • Idea
    • Kids
    • PowerPoint Backgrounds
    • Pricing
    • Resume Templates
    • Roadmap
    • Social Media
    • Strategy
    • Technology
  • Slide Deck
Recent Posts
  • Best Acknowledgment Samples and examples
  • 23
    Jul
    Você sabe que a roda de cores simples pode chamar a atenção?
  • Do you know the simple color wheel can catch the eye?
Copyright 2025 © SlideVilla.Com
  • Login
  • Sign Up
Forgot Password?
Lost your password? Please enter your username or email address. You will receive a link to create a new password via email.
Connect with:
Google

Login

Lost your password?

Register

Your personal data will be used to support your experience throughout this website, to manage access to your account, and for other purposes described in our privacy policy.