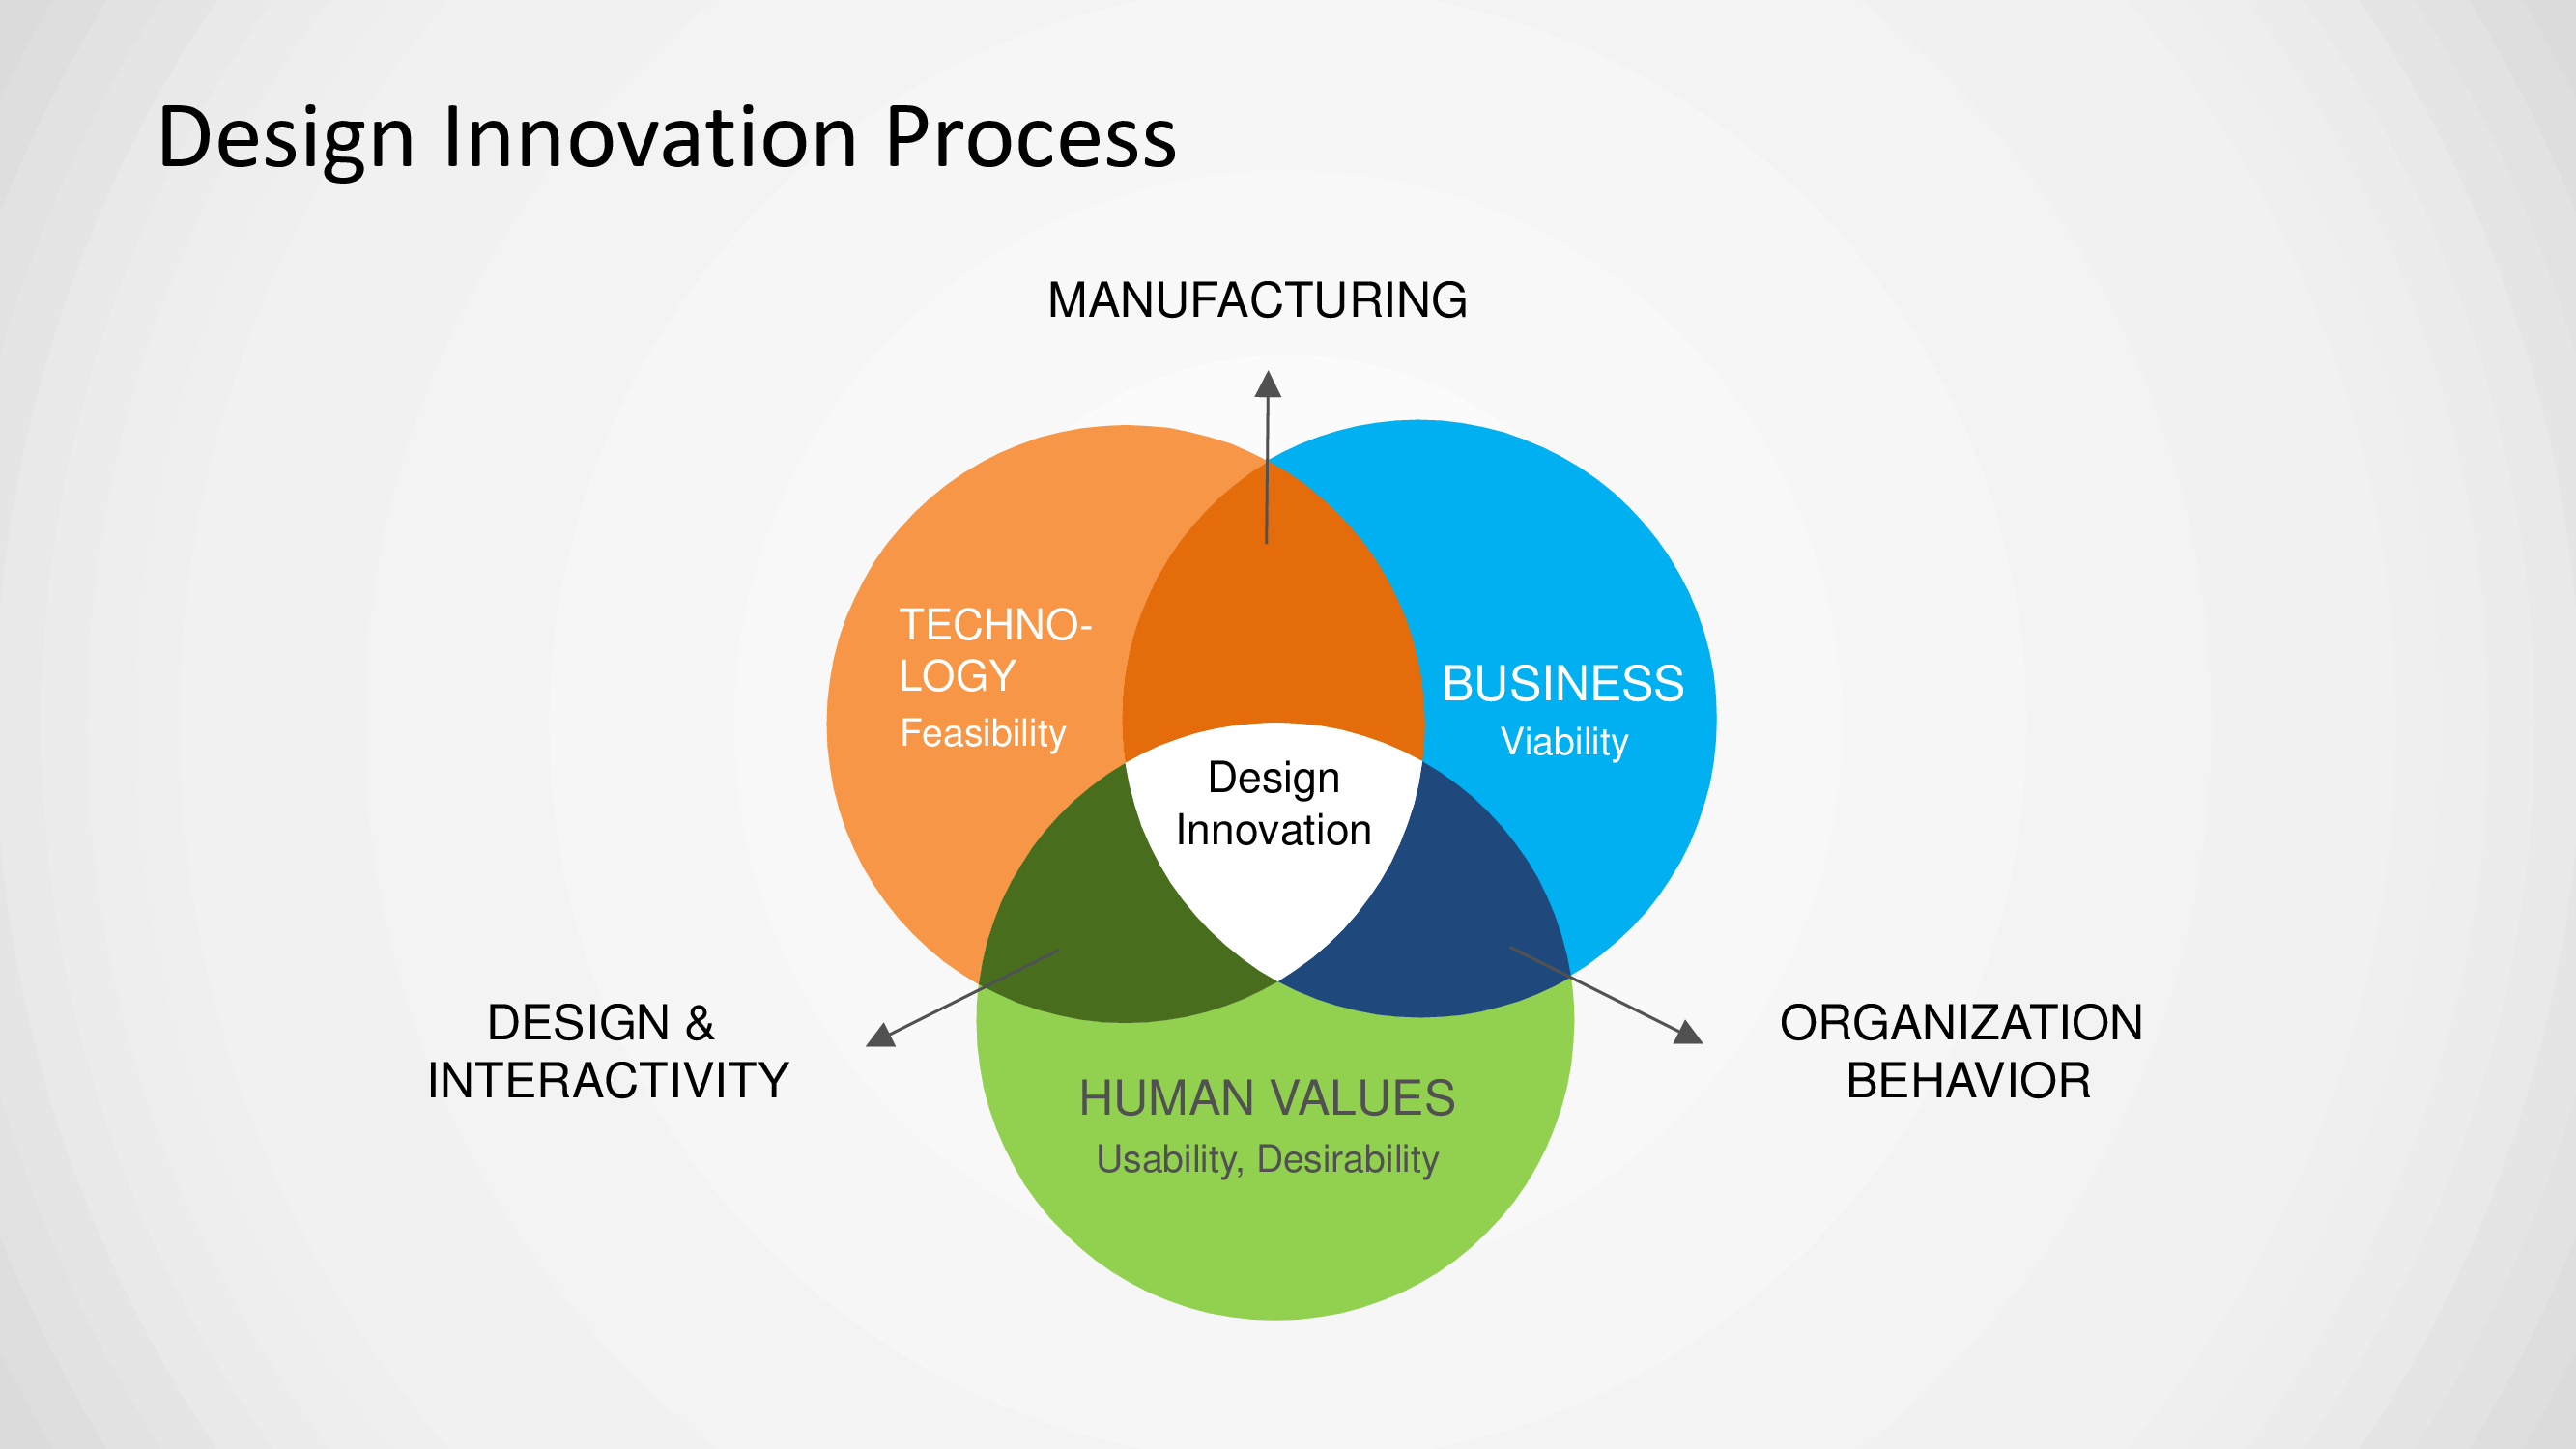
The Venn diagram design innovation design process is used for showing business ideas or topics that are inter-related to one another. Venn diagrams are run of the mill design that portrays the consistent connections. The absolute first slide is the normal Venn chart structure, which demonstrates the blossom like meeting circles. The essential structure of the Venn outline is ordinarily covering circles, with things in the converging segment bearing a shared characteristic. The articles dwelling in the external bits of the circles don’t share determined normal attributes. Venn outlines is a basic graphical portrayal of the relations that exists between two arrangements of things, they are substantially more intricate in both their direction and applications.
The beginning phase of any business task decides its prosperity even before it begins. Most pre-arranging procedures have three parts: conceptualizing, systems administration, and financing. These three components connect with one another to finish arrangements for the undertaking. Conceptualizing alludes to the phase where the group thinks of thoughts for the undertaking. These thoughts can go from item structures to showcasing systems. The second part, organizing, can incorporate endeavors to discover new providers and planned customers once the undertaking dispatches. Subsidizing, or financing, is the hugest of the three. Assets fuel its tasks. The layout includes a cutting-edge round graph. It is made with covering circles hued with current level structure slopes. The three noteworthy circles are shaded in dark, blue, and red. A white circle is found at the crossing point of the three circles. Each progression of the outline is brightened with a level PowerPoint symbol. These symbols incorporate a light, systems administration, and cash. Three succeeding slides highlight a similar chart. Be that as it may, in each slide, just one portion is shaded. By isolating one component from the others, the point can talked about more effectively.
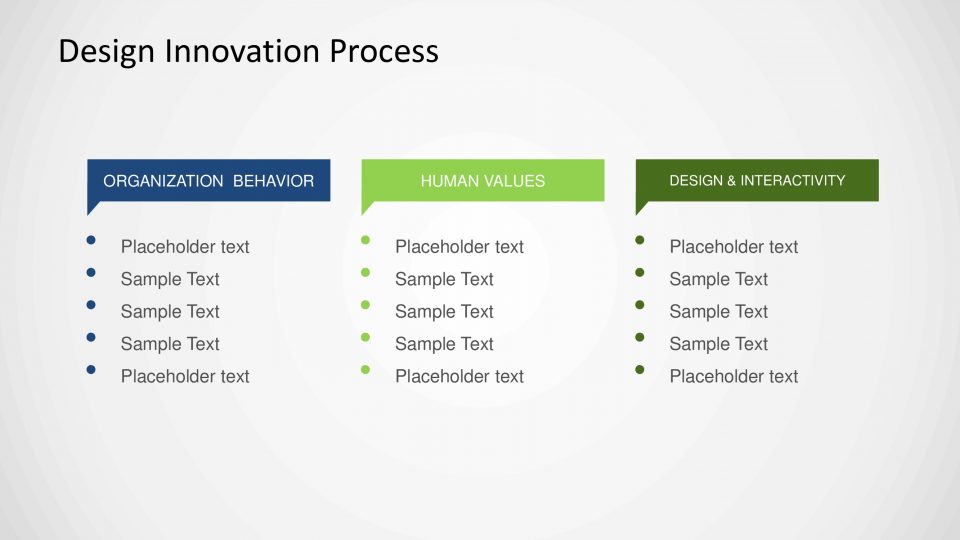
The outline slide, which contains a full-shading chart, is helpful for talking about the fundamental theme. The idea of arranging techniques can be set up. Connections between the components can be stressed. The individual slides, which highlight a solitary component, give settings to expounding on each part. Explicit subtleties identified with every component can be incorporated.
SlideVilla’s Animated Design Innovation process includes a Venn diagram that can be used to show components of Innovation or anything else you would like to present to the viewers. Since, SlideVilla harbours this template, it is completely editable, so don’t worry about that sort of thing. Happy presenting!
Features:
- Completely editable in terms of shape, color, size and text
- This template has a built in color theme which is unaffected by copy-pasting
- Includes an icon family with 135 unique completely editable icons
- Drag and drop image placeholder
- Completely editable (using spreadsheet) data-driven charts for displaying statistics
- Completely editable vector graphics
Supports
Microsoft PowerPoint 2010, 2011, 2013, 2016
MacOffice 2016, MacOffice 365



Be the first to review “Venn Diagram Design Innovation process”