Skip to content
    • Log In
    • Register
  • BLOG
  • FAQ
  • ABOUT US
  • CONTACT US
  • PRIVACY POLICY
  • Plans & Pricing
    • Log In
    • Register
SlidevillaSlidevilla

  • Plans & Pricing
  • ALL PRODUCTS
  • Login
  • PowerPoint Templates
    • Agile
    • Business PowerPoint Templates
    • Roadmap
    • Strategy
    • PowerPoint Backgrounds
    • Resume Templates
    • Progressive Roadmap
    • Self Introcution PPT
    • Diversity And Inclusion PPT
    • Roadmap PPT
    • Social Media
    • Kids
    • Idea
    • Health And Fitness
    • Technology
    • Pricing
    • PowerPoint Presentations
    • Slide Deck
  • PowerPoint Diagrams
    • Arrow Diagrams
    • Circular Diagrams
    • Flow Chart Diagrams
    • Funnel Diagrams
    • Process Flow Diagrams
    • Segmented Diagrams
    • Staged Diagrams
  • Power Point Maps
    • Africa
    • Asia
    • South America
    • Central America
    • Europe
    • North America
    • Oceania
    • World Maps & Globes
  • PowerPoint Shapes
    • 3D Shapes for PowerPoint
    • Cartoons
    • Creative
    • Gauges & Meters
    • Recycle
    • Traffic Lights & Signs Gears
  • Data & Charts
    • Bar Chart Presentation
    • Curves and Statistical
    • Pie Charts
    • Dashboards
  • Text & Tables
    • Creative Layouts
    • Comparison PPT Template
    • Comparison Template
  • Login
Home / Shop / Data & Charts / Bar Chart Presentation
Add to Wishlist

3 Series Bar Chart for PowerPoint Template

Download

Categories: Bar Chart Presentation, Business PowerPoint Templates, Data & Charts, PowerPoint Templates, Staged Diagrams Tags: bar chart, bar chart in construction management ppt, bar chart in project management ppt, bar chart ppt, bar chart ppt template, bar chart template, bar charts, business charts, clip art, customize chart, flat chart
Browse
  • Data & Charts
    • Bar Chart Presentation
    • Curves and Statistical
    • Dashboards
    • Pie Charts
  • Free for All
  • Power Point Maps
    • Africa
    • Asia
    • Central America
    • Europe
    • North America
    • Oceania
    • South America
    • World Maps & Globes
  • Power Point Text & Tables
    • Comparison PPT Template
    • Creative Layouts
  • PowerPoint Diagrams
    • Arrow Diagrams
    • Circular Diagrams
    • Flow Chart Diagrams
    • Funnel Diagrams
    • Process Flow Diagrams
    • Segmented Diagrams
    • Staged Diagrams
  • PowerPoint Presentations
  • PowerPoint Shapes
    • 3D Shapes for PowerPoint
    • Cartoons
    • Creative
    • Gauges & Meters
    • Recycle
    • Traffic Lights & Signs Gears
  • PowerPoint Templates
    • Agile
    • Business PowerPoint Templates
    • Health And Fitness
    • Idea
    • Kids
    • PowerPoint Backgrounds
    • Pricing
    • Resume Templates
    • Roadmap
    • Social Media
    • Strategy
    • Technology
  • Slide Deck
  • Description
  • Reviews (0)

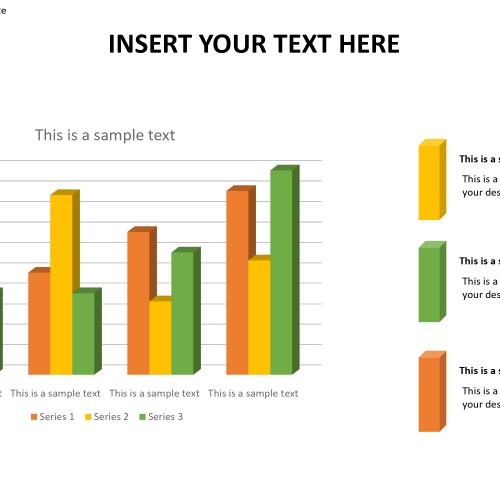
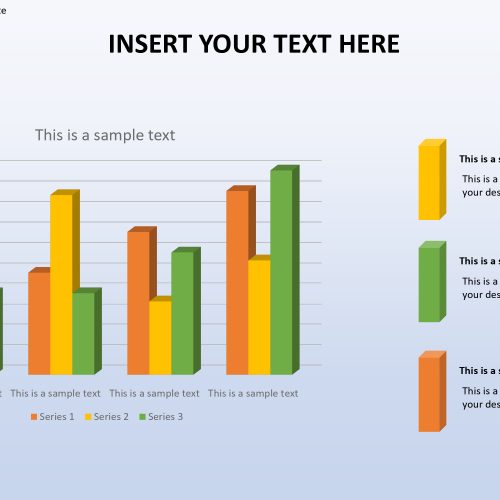
The bar chart clustered category PowerPoint template is an array of vertical bars that are grouped together in a cluster. The bars are color based and each color means something. At the far right of the template three icons of different colors (yellow, blue, green), are used to indicate what each color stands for, so the bars with the same colors show level of the information as depicted in the x and y axis.

The PowerPoint layout is ideal for information driven introductions, for example, showcasing and deals. It is nonexclusive which implies that any topic can be connected. It very well may be utilized in research introductions where the client can imagine grouped outcomes. It is perfect for insights and stock. Numerous business ideas can discover it very valuable, for example, money related announcing and in gauging techniques.

A clustered bar diagram comprises of numerous gatherings of information masterminded graphically. The information is quantitative and the stature of the bars is commonly relative to these qualities. The outline can stress of various homogeneous bunches in a heterogeneous setting. Along these lines, examination turns into significantly simpler. Examples can develop on the diagram and holes can be effectively recognized.

Features:

  • Completely editable in terms of shape, color, size and text
  • This template has a built in color theme which is unaffected by copy-pasting
  • Includes an icon family with 135 unique completely editable icons
  • Drag and drop image placeholder
  • Completely editable (using spreadsheet) data-driven charts for displaying statistics
  • Completely editable vector graphics

Supports
Microsoft PowerPoint 2010, 2011, 2013, 2016
MacOffice 2016, MacOffice 365

Reviews

There are no reviews yet.

Be the first to review “3 Series Bar Chart for PowerPoint Template” Cancel reply

Best Selling
  • Editable Brazil Map Template for PowerPoint
  • Employee Onboarding Roadmap PowerPoint Presentation
    Rated 4.00 out of 5
  • Action Plan PowerPoint Presentation Action Plan PowerPoint Presentation
  • Business Planning Powerpoint Presentation
Slides
  • Your Role Responsibilities and Expectations PowerPoint Presentation
  • Wellness Programs Taking Care of Yourself PowerPoint Presentation
  • Your First Project Getting Started PowerPoint Presentation
  • What is Information Technology PowerPoint Template PowerPoint Presentation
Featured
  • Go to Market Strategy template Go to Market Strategy template
    Rated 4.40 out of 5
    £5.00
  • Business Startup Powerpoint Template Business Startup Powerpoint Template
    Rated 4.43 out of 5
  • 5 Step Creative Cloud Diagram Template 5 Step Creative Cloud Diagram Template
  • Biochemistry slide template ppt Biochemistry slide template ppt
Top Rated
  • Agile Project Management PowerPoint Template Agile Project Management PowerPoint Template
    Rated 5.00 out of 5
  • Fingertip Electricity Concept PowerPoint Template Fingertip Electricity Concept PowerPoint Template
    Rated 5.00 out of 5
  • Startup Plans and Pricing PowerPoint Template Startup Plans and Pricing PowerPoint Template
    Rated 5.00 out of 5
  • Escalation Template For PowerPoint Escalation Template For PowerPoint
    Rated 5.00 out of 5
Our Clinets
COMPANY
  • BLOG
  • FAQ
  • ABOUT US
  • CONTACT US
  • PRIVACY POLICY
Product categories
  • Data & Charts
    • Bar Chart Presentation
    • Curves and Statistical
    • Dashboards
    • Pie Charts
  • Free for All
  • Power Point Maps
    • Africa
    • Asia
    • Central America
    • Europe
    • North America
    • Oceania
    • South America
    • World Maps & Globes
  • Power Point Text & Tables
    • Comparison PPT Template
    • Creative Layouts
  • PowerPoint Diagrams
    • Arrow Diagrams
    • Circular Diagrams
    • Flow Chart Diagrams
    • Funnel Diagrams
    • Process Flow Diagrams
    • Segmented Diagrams
    • Staged Diagrams
  • PowerPoint Presentations
  • PowerPoint Shapes
    • 3D Shapes for PowerPoint
    • Cartoons
    • Creative
    • Gauges & Meters
    • Recycle
    • Traffic Lights & Signs Gears
  • PowerPoint Templates
    • Agile
    • Business PowerPoint Templates
    • Health And Fitness
    • Idea
    • Kids
    • PowerPoint Backgrounds
    • Pricing
    • Resume Templates
    • Roadmap
    • Social Media
    • Strategy
    • Technology
  • Slide Deck
Recent Posts
  • Best Acknowledgment Samples and examples
  • 23
    Jul
    Você sabe que a roda de cores simples pode chamar a atenção?
  • Do you know the simple color wheel can catch the eye?
Copyright 2025 © SlideVilla.Com
  • Login
  • Sign Up
Forgot Password?
Lost your password? Please enter your username or email address. You will receive a link to create a new password via email.
Connect with:
Google

Login

Lost your password?

Register

Your personal data will be used to support your experience throughout this website, to manage access to your account, and for other purposes described in our privacy policy.