Skip to content
    • Log In
    • Register
  • BLOG
  • FAQ
  • ABOUT US
  • CONTACT US
  • PRIVACY POLICY
  • Plans & Pricing
    • Log In
    • Register
SlidevillaSlidevilla

  • Plans & Pricing
  • ALL PRODUCTS
  • Login
  • PowerPoint Templates
    • Agile
    • Business PowerPoint Templates
    • Roadmap
    • Strategy
    • PowerPoint Backgrounds
    • Resume Templates
    • Progressive Roadmap
    • Self Introcution PPT
    • Diversity And Inclusion PPT
    • Roadmap PPT
    • Social Media
    • Kids
    • Idea
    • Health And Fitness
    • Technology
    • Pricing
    • PowerPoint Presentations
    • Slide Deck
  • PowerPoint Diagrams
    • Arrow Diagrams
    • Circular Diagrams
    • Flow Chart Diagrams
    • Funnel Diagrams
    • Process Flow Diagrams
    • Segmented Diagrams
    • Staged Diagrams
  • Power Point Maps
    • Africa
    • Asia
    • South America
    • Central America
    • Europe
    • North America
    • Oceania
    • World Maps & Globes
  • PowerPoint Shapes
    • 3D Shapes for PowerPoint
    • Cartoons
    • Creative
    • Gauges & Meters
    • Recycle
    • Traffic Lights & Signs Gears
  • Data & Charts
    • Bar Chart Presentation
    • Curves and Statistical
    • Pie Charts
    • Dashboards
  • Text & Tables
    • Creative Layouts
    • Comparison PPT Template
    • Comparison Template
  • Login
Home / Shop / PowerPoint Presentations
Add to Wishlist

Visualizing Sales Targets Charts Graphs and Dashboards PowerPoint Presentation

Download

Category: PowerPoint Presentations Tags: dashboard visualization, PowerPoint SEO strategy, sales charts SEO, sales graphs analysis, sales presentation PowerPoint
Browse
  • Data & Charts
    • Bar Chart Presentation
    • Curves and Statistical
    • Dashboards
    • Pie Charts
  • Free for All
  • Power Point Maps
    • Africa
    • Asia
    • Central America
    • Europe
    • North America
    • Oceania
    • South America
    • World Maps & Globes
  • Power Point Text & Tables
    • Comparison PPT Template
    • Creative Layouts
  • PowerPoint Diagrams
    • Arrow Diagrams
    • Circular Diagrams
    • Flow Chart Diagrams
    • Funnel Diagrams
    • Process Flow Diagrams
    • Segmented Diagrams
    • Staged Diagrams
  • PowerPoint Presentations
  • PowerPoint Shapes
    • 3D Shapes for PowerPoint
    • Cartoons
    • Creative
    • Gauges & Meters
    • Recycle
    • Traffic Lights & Signs Gears
  • PowerPoint Templates
    • Agile
    • Business PowerPoint Templates
    • Health And Fitness
    • Idea
    • Kids
    • PowerPoint Backgrounds
    • Pricing
    • Resume Templates
    • Roadmap
    • Social Media
    • Strategy
    • Technology
  • Slide Deck
  • Description
  • Reviews (0)

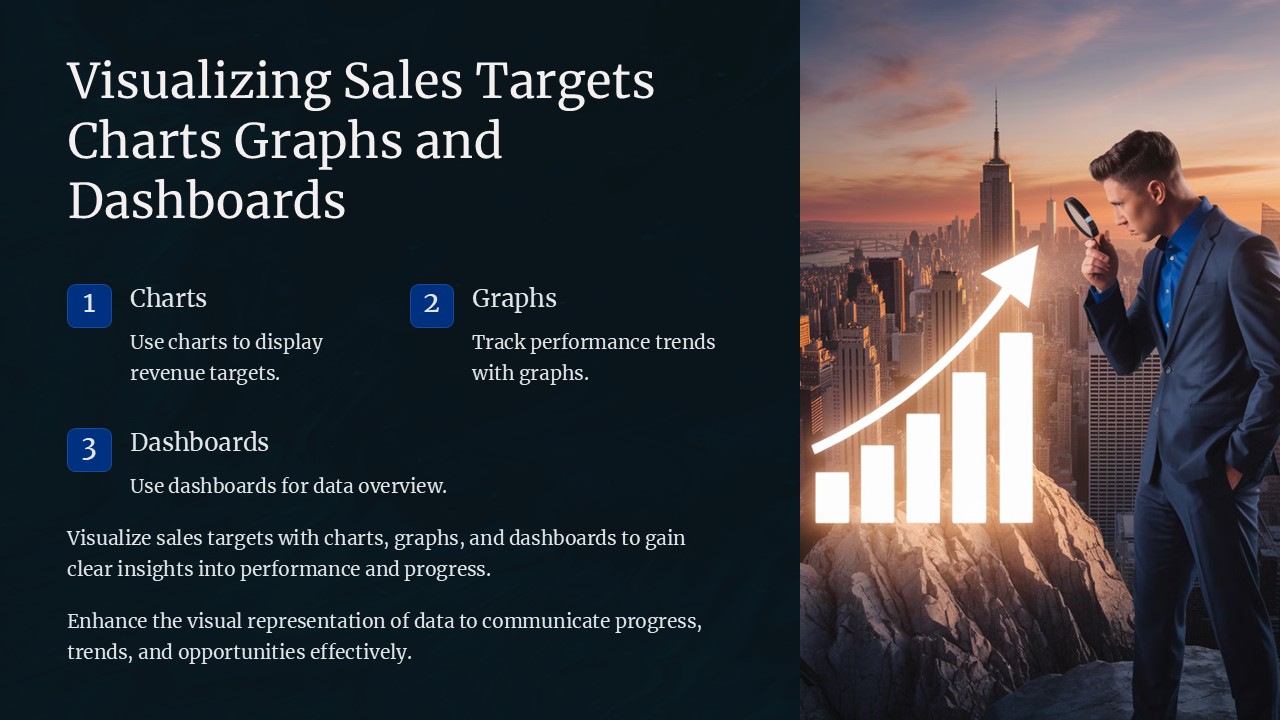
**Visualizing Sales Targets: Charts, Graphs, and Dashboards PowerPoint Presentation**

Unlock the full potential of your sales data with the “Visualizing Sales Targets: Charts, Graphs, and Dashboards PowerPoint Presentation.” This comprehensive PowerPoint template is designed to help professionals across all sectors effectively communicate their sales targets and achievements. Whether you’re presenting to stakeholders, team members, or potential investors, this tool will empower you to present your data in a clear, visually engaging manner.

With this PowerPoint presentation, you can transform complex sales data into easy-to-understand visuals that highlight key information and foster actionable insights. The template includes a variety of pre-designed slides, each tailored to showcase different aspects of sales data through innovative graphical representations.

**Key Components:**

– **Sales Performance Dashboards:** Get ready-to-use dashboard slides that provide a holistic view of sales performance against targets. These dashboards combine aesthetics with functionality, allowing you to track progress, identify trends, and make strategic decisions swiftly.

– **Target Achievement Graphs:** Utilize a range of graph styles, including bar graphs, line charts, and pie charts, to illustrate how your sales figures stack up against set targets. These graphs are not only visually appealing but also customizable to reflect specific data points.

– **Comparative Analysis Layouts:** Compare current sales performance with past data or against the competition with dual-axis charts and comparative layouts. This feature is particularly useful for quarterly reviews and strategic planning sessions.

– **Forecasting Models:** Project future sales and set realistic targets with forecasting slides that let you input historical data and visualize potential growth trajectories.

– **Interactive Elements:** Engage your audience with interactive slides that allow for real-time data manipulation. Adjust variables to see potential outcomes, making your presentation not just informative but also interactive.

**Customization and Usability:**

Designed with the user in mind, every slide in the “Visualizing Sales Targets” presentation is fully editable. You can easily adjust colors, text, and graphics to match your company’s branding or to highlight particular data. The templates support both PowerPoint and Google Slides, ensuring compatibility and flexibility regardless of your preferred presentation software.

**Features:**

– **Fully Editable Templates:** Tailor each slide to your specific needs without any hassle. Change colors, modify shapes, and replace text areas effortlessly to fit your data and branding.

– **Supports PowerPoint and Google Slides:** Whether you are a Microsoft Office veteran or a Google Slides enthusiast, this template works seamlessly across both platforms, giving you the flexibility to present from virtually anywhere.

– **Drag and Drop Functionality:** Customizing your charts and graphs is as easy as dragging and dropping elements within the slides. This feature simplifies the process of data representation, making it accessible even for those with minimal graphic design experience.

– **Wide Variety of Chart Types:** Choose from an extensive array of chart types to best represent your data. Each type is designed to be as informative as it is attractive, ensuring your data stands out.

The “Visualizing Sales Targets: Charts, Graphs, and Dashboards PowerPoint Presentation” is an indispensable tool for anyone who needs to report on sales performance and forecasts. It not only enhances how you visualize and present data but also improves how your audience perceives and interacts with the information. Equip your presentations with the power of professional, dynamic sales visualization and make every data point count!

Reviews

There are no reviews yet.

Be the first to review “Visualizing Sales Targets Charts Graphs and Dashboards PowerPoint Presentation” Cancel reply

Best Selling
  • Editable Brazil Map Template for PowerPoint
  • Business process and achievement template Business process and achievement template
    Rated 4.30 out of 5
  • Timeline for sales promotion Powerpoint template Timeline for sales promotion Powerpoint template
    Rated 4.20 out of 5
  • 5 step vertical banner timeline PowerPoint template 5 step vertical banner timeline PowerPoint template
    Rated 4.50 out of 5
Slides
  • Visualizing Data With Iceberg Graphics PowerPoint Presentation
  • World Map Travel PowerPoint Presentation
  • World Map Arrows PowerPoint Presentation
  • Timeline With Phases PowerPoint Presentation
Featured
  • Go to Market Strategy template Go to Market Strategy template
    Rated 4.40 out of 5
    £5.00
  • Business Action Plan Power Point Template Business Action Plan Power Point Template
    Rated 4.60 out of 5
  • Funnel Diagram template Funnel Diagram template
    Rated 4.79 out of 5
  • Ladder Infographic template Ladder Infographic template
    Rated 5.00 out of 5
Top Rated
  • 4 Columns Animated Greek Temple 3D PowerPoint Template 4 Columns Animated Greek Temple 3D PowerPoint Template
    Rated 5.00 out of 5
  • Swot analysis template powerpoint Swot analysis template powerpoint
    Rated 5.00 out of 5
  • Creative Roadmap PowerPoint Template Creative Roadmap PowerPoint Template
    Rated 5.00 out of 5
  • Architect Resume Template
    Rated 5.00 out of 5
Our Clinets
COMPANY
  • BLOG
  • FAQ
  • ABOUT US
  • CONTACT US
  • PRIVACY POLICY
Product categories
  • Data & Charts
    • Bar Chart Presentation
    • Curves and Statistical
    • Dashboards
    • Pie Charts
  • Free for All
  • Power Point Maps
    • Africa
    • Asia
    • Central America
    • Europe
    • North America
    • Oceania
    • South America
    • World Maps & Globes
  • Power Point Text & Tables
    • Comparison PPT Template
    • Creative Layouts
  • PowerPoint Diagrams
    • Arrow Diagrams
    • Circular Diagrams
    • Flow Chart Diagrams
    • Funnel Diagrams
    • Process Flow Diagrams
    • Segmented Diagrams
    • Staged Diagrams
  • PowerPoint Presentations
  • PowerPoint Shapes
    • 3D Shapes for PowerPoint
    • Cartoons
    • Creative
    • Gauges & Meters
    • Recycle
    • Traffic Lights & Signs Gears
  • PowerPoint Templates
    • Agile
    • Business PowerPoint Templates
    • Health And Fitness
    • Idea
    • Kids
    • PowerPoint Backgrounds
    • Pricing
    • Resume Templates
    • Roadmap
    • Social Media
    • Strategy
    • Technology
  • Slide Deck
Recent Posts
  • Best Acknowledgment Samples and examples
  • 23
    Jul
    Você sabe que a roda de cores simples pode chamar a atenção?
  • Do you know the simple color wheel can catch the eye?
Copyright 2025 © SlideVilla.Com
  • Login
  • Sign Up
Forgot Password?
Lost your password? Please enter your username or email address. You will receive a link to create a new password via email.
Connect with:
Google

Login

Lost your password?

Register

Your personal data will be used to support your experience throughout this website, to manage access to your account, and for other purposes described in our privacy policy.