Skip to content
    • Log In
    • Register
  • BLOG
  • FAQ
  • ABOUT US
  • CONTACT US
  • PRIVACY POLICY
  • Plans & Pricing
    • Log In
    • Register
SlidevillaSlidevilla

  • Plans & Pricing
  • ALL PRODUCTS
  • Login
  • PowerPoint Templates
    • Agile
    • Business PowerPoint Templates
    • Roadmap
    • Strategy
    • PowerPoint Backgrounds
    • Resume Templates
    • Progressive Roadmap
    • Self Introcution PPT
    • Diversity And Inclusion PPT
    • Roadmap PPT
    • Social Media
    • Kids
    • Idea
    • Health And Fitness
    • Technology
    • Pricing
    • PowerPoint Presentations
    • Slide Deck
  • PowerPoint Diagrams
    • Arrow Diagrams
    • Circular Diagrams
    • Flow Chart Diagrams
    • Funnel Diagrams
    • Process Flow Diagrams
    • Segmented Diagrams
    • Staged Diagrams
  • Power Point Maps
    • Africa
    • Asia
    • South America
    • Central America
    • Europe
    • North America
    • Oceania
    • World Maps & Globes
  • PowerPoint Shapes
    • 3D Shapes for PowerPoint
    • Cartoons
    • Creative
    • Gauges & Meters
    • Recycle
    • Traffic Lights & Signs Gears
  • Data & Charts
    • Bar Chart Presentation
    • Curves and Statistical
    • Pie Charts
    • Dashboards
  • Text & Tables
    • Creative Layouts
    • Comparison PPT Template
    • Comparison Template
  • Login
Home / Shop / PowerPoint Presentations
Add to Wishlist

Target vs Actual Performance Tracking Progress PowerPoint Presentation

Download

Category: PowerPoint Presentations Tags: business presentation SEO, performance analysis tags, performance tracking PowerPoint, progress tracking keywords, target vs actual comparison
Browse
  • Data & Charts
    • Bar Chart Presentation
    • Curves and Statistical
    • Dashboards
    • Pie Charts
  • Free for All
  • Power Point Maps
    • Africa
    • Asia
    • Central America
    • Europe
    • North America
    • Oceania
    • South America
    • World Maps & Globes
  • Power Point Text & Tables
    • Comparison PPT Template
    • Creative Layouts
  • PowerPoint Diagrams
    • Arrow Diagrams
    • Circular Diagrams
    • Flow Chart Diagrams
    • Funnel Diagrams
    • Process Flow Diagrams
    • Segmented Diagrams
    • Staged Diagrams
  • PowerPoint Presentations
  • PowerPoint Shapes
    • 3D Shapes for PowerPoint
    • Cartoons
    • Creative
    • Gauges & Meters
    • Recycle
    • Traffic Lights & Signs Gears
  • PowerPoint Templates
    • Agile
    • Business PowerPoint Templates
    • Health And Fitness
    • Idea
    • Kids
    • PowerPoint Backgrounds
    • Pricing
    • Resume Templates
    • Roadmap
    • Social Media
    • Strategy
    • Technology
  • Slide Deck
  • Description
  • Reviews (0)

Introducing the Target vs Actual Performance Tracking Progress PowerPoint Presentation, a meticulously designed tool that will revolutionize the way you monitor and present your business objectives and outcomes. This comprehensive presentation template is crafted to facilitate clear, concise, and visually engaging comparisons between planned targets and actual results, making it an indispensable asset for managers, analysts, project coordinators, and business executives.

The core of this presentation is its ability to clearly depict the variance between your set goals and the real-time performance of your team or company. Whether you’re presenting quarterly sales, marketing campaign results, financial forecasts vs. actuals, or tracking project milestones, this PowerPoint template ensures your data is not only accessible but also compelling.

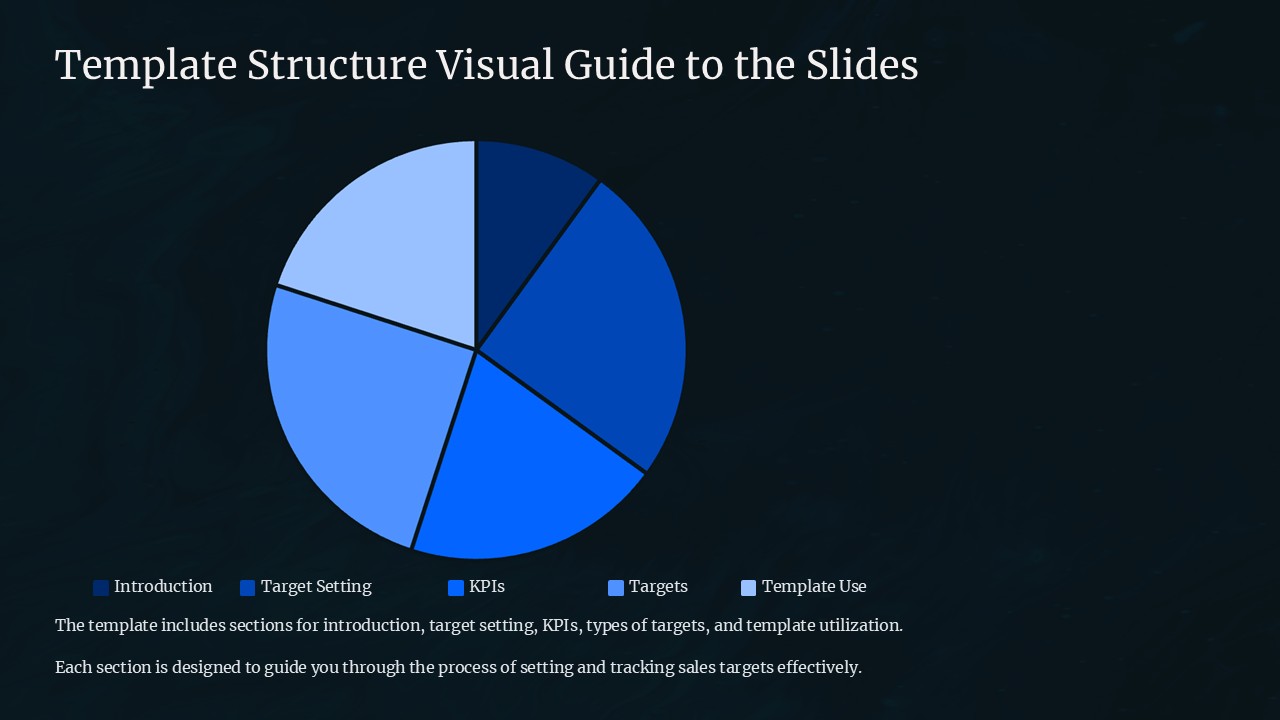
This PowerPoint presentation contains a range of slides, each designed with a specific purpose to aid in effective communication. Starting with an introductory slide to set the context, the presentation moves into more detailed slides, each tailored to represent different aspects of performance metrics. The slides include graphical representations like bar charts, line graphs, and pie charts, which are essential for making the numerical data easy to understand at a glance.

Moreover, the design aesthetics are not just about beauty but also about functionality. The color schemes are chosen to enhance visual impact and focus attention where it’s most needed, on the data differences. Text placeholders are strategically placed to allow for explanatory notes and analysis without cluttering the visual space.

Key Features:
– **Fully Editable Templates**: Every element of the presentation, from text to the color palette and design elements like shapes and icons, can be customized to suit your specific needs. This flexibility allows you to maintain consistency with your company’s branding or project theme without needing external design software.
– **Supports PowerPoint and Google Slides**: Whether you prefer using Microsoft PowerPoint or Google Slides, this template is compatible with both platforms, giving you the versatility to work from your preferred application. Seamless integration with Google Slides also means you can easily share and collaborate with your team online, enhancing productivity and ensuring everyone is on the same page.
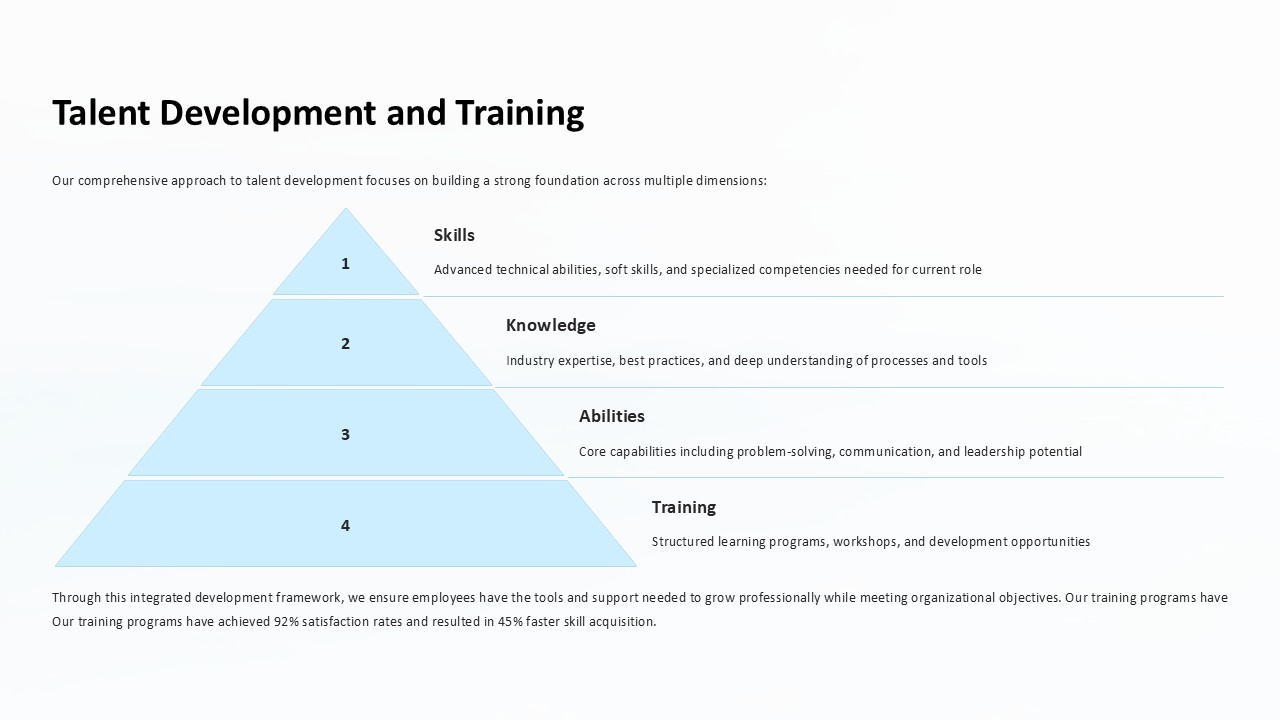
– **Diverse Slide Layouts**: The template includes a variety of slide layouts, each designed to showcase different types of data and analysis. This variety helps in maintaining audience engagement and allows you to tailor the presentation according to the complexity and depth of the data being discussed.
– **User-Friendly Design**: Even if you’re not a design expert, this template is structured to be intuitive. With clear instructions and easy-to-follow setup, you can start inputting your data right away and make adjustments with just a few clicks.

The Target vs Actual Performance Tracking Progress PowerPoint Presentation is more than just a tool; it’s a critical asset for ensuring that your performance reviews are as strategic and impactful as possible. Whether it’s for internal review meetings, stakeholder presentations, or annual reports, this template will help you present your achievements and insights in the most effective manner possible. Equip your business presentations with the clarity and precision they deserve to drive home the success of your strategic initiatives.

Reviews

There are no reviews yet.

Be the first to review “Target vs Actual Performance Tracking Progress PowerPoint Presentation” Cancel reply

Best Selling
  • Editable Brazil Map Template for PowerPoint
  • Businessman PowerPoint Presentation
  • 3 Phase Cycle PowerPoint Presentation
  • Conference agenda powerpoint template slide Conference agenda powerpoint template slide
Slides
  • Visualizing Data With Iceberg Graphics PowerPoint Presentation
  • World Map Travel PowerPoint Presentation
  • World Map Arrows PowerPoint Presentation
  • Timeline With Phases PowerPoint Presentation
Featured
  • Go to Market Strategy template Go to Market Strategy template
    Rated 4.40 out of 5
    £5.00
  • Conference agenda powerpoint template slide Conference agenda powerpoint template slide
  • Chemical Industry shapes Chemical Industry shapes
  • Organization Chart PowerPoint Template Organization Chart PowerPoint Template
    Rated 4.69 out of 5
Top Rated
  • Gadgets Comparison Table for PowerPoint Template
    Rated 5.00 out of 5
  • Resignation letter template slide for powerpoint Resignation letter template slide for powerpoint
    Rated 5.00 out of 5
  • Current State Vs Future State Infographics PowerPoint Template Current State Vs Future State Infographics PowerPoint Template
    Rated 5.00 out of 5
  • Recruitment and Selection Policy PowerPoint Presentation Recruitment and Selection Policy PowerPoint Presentation
    Rated 5.00 out of 5
Our Clinets
COMPANY
  • BLOG
  • FAQ
  • ABOUT US
  • CONTACT US
  • PRIVACY POLICY
Product categories
  • Data & Charts
    • Bar Chart Presentation
    • Curves and Statistical
    • Dashboards
    • Pie Charts
  • Free for All
  • Power Point Maps
    • Africa
    • Asia
    • Central America
    • Europe
    • North America
    • Oceania
    • South America
    • World Maps & Globes
  • Power Point Text & Tables
    • Comparison PPT Template
    • Creative Layouts
  • PowerPoint Diagrams
    • Arrow Diagrams
    • Circular Diagrams
    • Flow Chart Diagrams
    • Funnel Diagrams
    • Process Flow Diagrams
    • Segmented Diagrams
    • Staged Diagrams
  • PowerPoint Presentations
  • PowerPoint Shapes
    • 3D Shapes for PowerPoint
    • Cartoons
    • Creative
    • Gauges & Meters
    • Recycle
    • Traffic Lights & Signs Gears
  • PowerPoint Templates
    • Agile
    • Business PowerPoint Templates
    • Health And Fitness
    • Idea
    • Kids
    • PowerPoint Backgrounds
    • Pricing
    • Resume Templates
    • Roadmap
    • Social Media
    • Strategy
    • Technology
  • Slide Deck
Recent Posts
  • Best Acknowledgment Samples and examples
  • 23
    Jul
    Você sabe que a roda de cores simples pode chamar a atenção?
  • Do you know the simple color wheel can catch the eye?
Copyright 2025 © SlideVilla.Com
  • Login
  • Sign Up
Forgot Password?
Lost your password? Please enter your username or email address. You will receive a link to create a new password via email.
Connect with:
Google

Login

Lost your password?

Register

Your personal data will be used to support your experience throughout this website, to manage access to your account, and for other purposes described in our privacy policy.